Key Takeaways (TL;DR)
- What is it? Business intelligence (BI) reporting uses software tools to collect, analyze, and visualize organizational data—transforming raw numbers into dashboards, charts, and reports that drive smarter decisions.
- Key Benefit: Eliminates guesswork by giving every team real-time access to a single source of truth, leading to faster, data-driven decisions.
- Cost: $5,000–$150,000+ annually depending on platform, user count, and data complexity.
- Timeline: 4–12 weeks for initial deployment; ongoing refinement as data sources expand.
- Best For: Growing organizations with 10+ users who need cross-department visibility into sales, marketing, service, and operations data.
- ROI: 112–127% within three years, with decision-making speed improving by up to 27%.
Introduction: Why Business Intelligence Reporting Matters Now
Every organization generates data—from CRM records and marketing campaigns to support tickets and financial transactions. But raw data sitting in disconnected spreadsheets and siloed systems doesn't drive growth. Business intelligence (BI) reporting bridges the gap between data collection and data-driven action.
According to recent research, 94% of organizations rate BI and analytics as either critical or very important to their business success. Yet only 24% of business leaders worldwide can independently read and interpret organizational data. That disconnect represents both a challenge and an opportunity for growing businesses.
In this guide, you'll learn exactly what BI reporting is, how it works, the key benefits it delivers, how it integrates with CRM platforms like Salesforce and HubSpot, and the practical steps to get started. Whether you're exploring BI for the first time or evaluating ways to level up your current reporting, this guide is your roadmap.
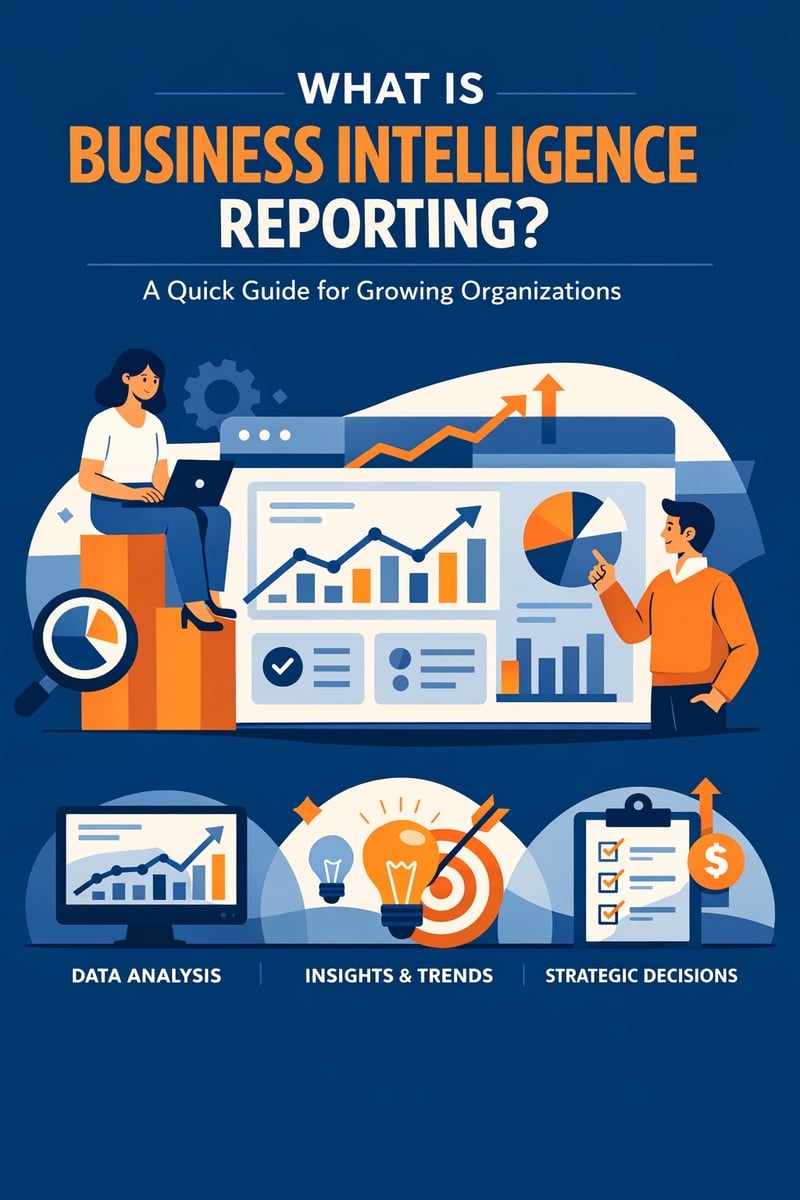
What Is Business Intelligence Reporting?
Business intelligence reporting is the process of using software tools and technologies to collect, organize, analyze, and present business data in formats that support decision-making. The output typically includes interactive dashboards, visual reports, charts, graphs, and KPI scorecards that give stakeholders at every level a clear picture of organizational performance.
Unlike static spreadsheets or one-off data pulls, BI reporting is:
- Automated: Data refreshes on a schedule (or in real time) so reports are always current.
- Visual: Charts, graphs, maps, and gauges make complex data easy to understand at a glance.
- Interactive: Users can filter, drill down, and explore data without writing code or SQL queries.
- Self-service: Non-technical team members can build and customize their own reports without relying on IT.
How Does BI Reporting Differ From Traditional Reporting?
Traditional reporting typically involves IT teams pulling data, building static reports in Excel, and emailing them to stakeholders days or weeks after the fact. By the time decision-makers see the numbers, they're already outdated.
Modern BI reporting flips this model:
| Feature | Traditional Reporting | BI Reporting |
|---|---|---|
| Data freshness | Days or weeks old | Real-time or near-real-time |
| Access | IT-generated, emailed to stakeholders | Self-service, accessible via web/mobile |
| Interactivity | Static tables and charts | Drill-down, filtering, dynamic visuals |
| Scalability | Manual effort for each new report | Automated, scalable to hundreds of users |
| Insights | Descriptive (what happened) | Predictive and prescriptive (what will happen, what to do) |
How Does Business Intelligence Reporting Work?
Step 1: Data Collection and Integration
BI tools connect to your organization's data sources—CRM systems (Salesforce, HubSpot), ERP software, marketing platforms, financial systems, spreadsheets, and databases. Through ETL (Extract, Transform, Load) processes, data is pulled, cleaned, and standardized into a unified data model.
Why this matters: Organizations using CRM platforms like Salesforce or HubSpot already have rich customer, sales, and service data. BI reporting unlocks that data's full potential by combining it with other business systems.
Step 2: Data Storage and Governance
Cleaned data is stored in a centralized data warehouse or data lake where it becomes the organization's single source of truth. Data governance policies ensure the right people access the right data, maintaining security and compliance.
Step 3: Analysis and Exploration
With data centralized, teams can analyze trends, identify patterns, compare performance, and forecast future outcomes. Modern BI platforms incorporate AI and machine learning to surface insights automatically—89% of BI professionals consider AI and ML important or very important for the future of BI.
Step 4: Visualization and Sharing
Insights are presented through interactive dashboards, reports, charts, and scorecards. These can be shared across the organization, embedded in other applications (like your CRM), or delivered via automated email alerts.
What Are the Key Benefits of BI Reporting?
1. Faster, Data-Driven Decision-Making
Data analytics makes decision-making 5 times faster for businesses. Instead of waiting for weekly reports, teams access real-time dashboards that show exactly what's happening right now. 56% of organizations using analytics report faster and more effective decision-making.
2. Improved Revenue and Profitability
BI leads to an average 15% increase in profitability. Data-driven organizations are 23 times more likely to acquire customers, 6 times more likely to retain them, and 19 times more likely to be profitable overall.
3. Reduced Operational Costs
BI reduces operational costs by an average of 20% by identifying inefficiencies, automating manual reporting tasks, and eliminating redundant processes. The time your team spends manually building reports in spreadsheets can be redirected toward strategic work.
4. Enhanced Customer Satisfaction
Customer satisfaction rises by 34% when decisions are driven by live data insights. When sales, service, and marketing teams share a unified view of every customer interaction, they deliver more personalized, responsive experiences.
5. Cross-Department Visibility
BI reporting breaks down data silos by unifying information from sales, marketing, service, finance, and operations into a single platform. Everyone works from the same numbers, reducing conflicts and misalignment.
6. Accountability and Transparency
When performance data is visible to everyone, problems have nowhere to hide. Teams can see which regions, reps, campaigns, or processes are underperforming—and take corrective action immediately.
How Does BI Reporting Integrate With CRM Platforms?
For growing organizations, the most impactful BI implementations connect directly to CRM platforms where customer and sales data lives. Here's how BI reporting enhances the two leading CRM ecosystems:
BI Reporting With Salesforce
Salesforce offers built-in reporting and dashboards, but organizations often outgrow native capabilities as they scale. Integrating Salesforce with dedicated BI tools (or leveraging Salesforce's own Data Cloud and Tableau CRM) enables:
- Cross-object reporting that combines sales pipeline, service cases, and marketing engagement data
- Predictive lead scoring using AI-powered analytics
- Executive dashboards that aggregate data from multiple Salesforce orgs or business units
- Historical trend analysis beyond Salesforce's standard reporting limits
BI Reporting With HubSpot
HubSpot's reporting tools are powerful for marketing and sales analytics, but BI integration takes it further:
- Multi-source reporting that blends HubSpot CRM data with financial, operational, and third-party data
- Custom attribution models that track the full customer journey across channels
- Advanced segmentation for targeted campaigns based on behavioral patterns
- Automated report distribution to stakeholders who don't log into HubSpot
The Integration Advantage
When BI reporting sits on top of your CRM, you get a 360-degree view of the customer lifecycle—from first touch through closed deal to ongoing support. Integration platforms like MuleSoft or Workato connect your CRM data with ERP, marketing automation, and other systems, creating a unified data foundation for BI.
What Are the Most Common Types of BI Reports?
Dashboards
Interactive, real-time visual displays that combine multiple charts, graphs, and KPIs on a single screen. Ideal for executives and managers who need a quick performance overview.
Operational Reports
Detailed, granular reports focused on day-to-day business activities—sales pipeline status, support ticket volumes, campaign performance metrics. These are typically used by frontline managers and individual contributors.
Ad Hoc Reports
On-demand reports created to answer specific questions. Self-service BI tools empower users to build these without IT involvement—70% of respondents say self-service BI is vital to their organization.
Scheduled Reports
Automated reports delivered on a set cadence (daily, weekly, monthly) to keep stakeholders informed without requiring them to log into the BI platform.
Predictive Reports
Reports that use historical data, AI, and machine learning to forecast future trends—revenue projections, churn risk scores, demand forecasts. 73% of organizations have implemented or are planning AI-powered predictive analytics within two years.
What Should Growing Organizations Look for in a BI Reporting Tool?
Ease of Use
Look for intuitive, drag-and-drop interfaces that enable non-technical users to create reports and dashboards. The faster your team can adopt the tool, the faster you'll see ROI.
CRM Integration
Ensure the BI tool integrates natively with your CRM platform (Salesforce, HubSpot, or both). Pre-built connectors dramatically reduce implementation time.
Scalability
Choose a platform that grows with your organization. Consider user limits, data volume capacity, and the ability to add new data sources over time.
Real-Time Data
75% of businesses now rely on cloud-based BI solutions. Cloud-native tools offer real-time data refresh, remote access, and automatic updates without IT maintenance.
AI and Predictive Capabilities
AI-powered augmented analytics accounts for 40% of new BI deployments. Prioritize tools with built-in AI for trend detection, anomaly alerts, and forecasting.
Security and Governance
Ensure the platform supports role-based access controls, data encryption, and compliance with industry regulations. 46% of organizations cite data privacy and security as a challenge.
Cost Transparency
Look for transparent pricing that scales predictably. Avoid platforms with hidden costs for users, data storage, or premium features.
Best Practices for Implementing BI Reporting
Start With Clear Business Questions
Don't build reports for the sake of building reports. Start by identifying the top 5–10 business questions your organization needs to answer: What's our sales pipeline health? Which campaigns drive the most revenue? Where are customers churning?
Clean Your Data First
Poor data quality costs the U.S. economy approximately $3.1 trillion annually. Before launching BI reporting, invest in data cleanup—standardize formats, remove duplicates, fill gaps, and establish data governance policies.
Begin With Quick Wins
Start with a single department or use case (like sales pipeline reporting) to demonstrate value quickly. Early wins build organizational buy-in for broader BI adoption.
Invest in Data Literacy
Only 25% of new employees feel confident using organizational data. Provide training on BI tools and data interpretation so your team can fully leverage self-service capabilities.
Establish a Single Source of Truth
Ensure all teams reference the same data and definitions. Inconsistent data definitions affect 45% of organizations and lead to conflicting reports and eroded trust.
Iterate and Expand
BI implementation is not a one-time project. Continuously add new data sources, refine dashboards, and respond to evolving business needs. The most successful BI programs treat reporting as an ongoing capability, not a destination.
How Much Does BI Reporting Cost?
BI reporting costs vary widely depending on platform choice, user count, data volume, and implementation complexity:
| Component | Estimated Cost Range |
|---|---|
| BI Platform Licensing | $0 (free tiers) – $70/user/month for enterprise tools |
| Implementation & Configuration | $5,000 – $50,000+ depending on complexity |
| Data Integration (ETL) | $10,000 – $75,000 for multi-source integration |
| Training & Adoption | $2,000 – $15,000 for team onboarding |
| Ongoing Maintenance | 10–20% of initial investment annually |
Total first-year investment for a mid-size organization typically ranges from $20,000 to $150,000, with ROI of 112–127% within three years.
For organizations already using Salesforce or HubSpot, built-in reporting tools provide a no-additional-cost starting point, with options to scale into more advanced BI as needs grow.
Frequently Asked Questions (FAQ)
What is business intelligence reporting in simple terms?
Business intelligence reporting is the process of using software to turn your organization's raw data into visual reports, dashboards, and charts that help teams make better, faster decisions.
How is BI reporting different from data analytics?
BI reporting focuses on presenting what is happening and what has happened through dashboards and reports. Data analytics goes deeper, using statistical methods, AI, and machine learning to explore why something happened and predict what will happen next. Modern BI tools increasingly incorporate both.
Do small businesses need BI reporting?
Yes. Small businesses benefit from BI reporting by gaining visibility into sales, marketing, and operational performance without hiring dedicated analysts. Self-service BI tools make it affordable and accessible—91% of small business users rely on self-service BI for report viewing.
What CRM platforms work best with BI reporting?
Salesforce and HubSpot are the two most widely used CRM platforms that integrate with BI tools. Both offer native reporting capabilities, with options to connect external BI platforms like Tableau, Power BI, or Looker for more advanced analysis.
How long does it take to implement BI reporting?
Initial BI reporting setups typically take 4–12 weeks, depending on the number of data sources, data quality, and organizational complexity. Quick-start implementations focused on a single department can be completed in as little as 2–3 weeks.
What is the ROI of BI reporting?
Studies consistently show BI delivers strong ROI: 112–127% within three years, with payback periods averaging 1.6 years. Organizations also report 20% reductions in operational costs and 15% increases in profitability.
What are the biggest challenges with BI reporting?
The top challenges include poor data quality (affecting 64% of organizations), low data literacy across the workforce, data silos that prevent unified analysis, and inconsistent data definitions across departments.
Conclusion: Turn Your Data Into a Competitive Advantage
Business intelligence reporting isn't a luxury reserved for enterprise companies with massive budgets. Today's cloud-based, AI-powered BI tools make it practical and affordable for growing organizations of any size to transform their data into a strategic asset.
The key is starting with a clear strategy: define the business questions you need to answer, ensure your CRM and operational data is clean and connected, choose a BI platform that scales with your growth, and invest in your team's data literacy.
Ready to unlock the full potential of your organization's data? Vantage Point helps businesses implement and optimize BI reporting solutions that integrate seamlessly with Salesforce, HubSpot, and the broader technology ecosystem. From CRM configuration to data integration with MuleSoft and AI-powered analytics, we deliver the unified data foundation your team needs to make smarter decisions, faster.
Contact Vantage Point to start your BI reporting journey today.
About Vantage Point
Vantage Point is a technology consulting firm specializing in CRM implementation, data integration, and AI-powered business solutions. As partners with Salesforce, HubSpot, Anthropic (Claude AI), Aircall, and Workato, we help organizations of all sizes unify their data, automate their workflows, and accelerate growth. From Sales Cloud and Service Cloud to MuleSoft integration and Data Cloud analytics, Vantage Point delivers end-to-end solutions that turn technology into a competitive advantage. Learn more at vantagepoint.io.