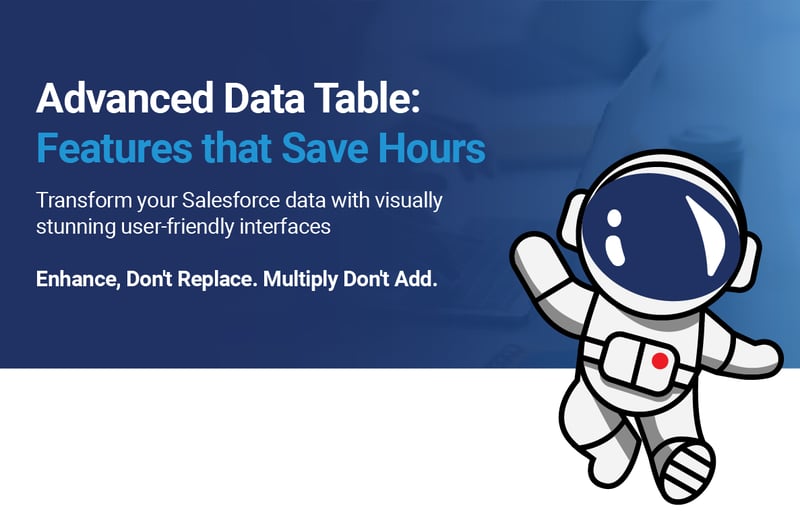
What Are the Biggest Salesforce Productivity Killers?
You've got the beautiful interface. You've got the powerful filtering. You've got the flexible configuration. Now let's talk about the features that make your team say, "How did we ever work without this?"
These aren't just nice-to-haves — these are the tools that turn 30-minute tasks into 30-second tasks and deliver real, measurable ROI.
Your team has workarounds they don't even notice anymore:
- Export a report? — Copy-paste to Excel and format for 15 minutes
- Check for updates? — Click refresh 47 times a day
- Share filtered data? — Screenshot, email, apologize for the formatting
- Analyze a subset of records? — Download everything, filter in Excel
- Work with long descriptions? — Squint at truncated text, click to open record, go back, repeat
Each one seems small. But multiply by users, multiply by frequency, multiply by years — and you've been accepting friction that doesn't have to exist.
📊 Key Stat: The average Salesforce user wastes 70+ minutes per day on repetitive data tasks that can be automated with the right tools.
What Are the 7 Game-Changing Features of Advanced Data Table?
Here are the top productivity-boosting features, ranked in order of impact:
| Feature | Time Saved Per Day | Key Benefit |
|---|---|---|
| One-Click CSV Export | 15 minutes | Perfectly formatted, ready-to-analyze files |
| Smart Auto-Refresh | 3 minutes | Eliminates compulsive refresh clicking |
| Instant Filtering | 30 minutes | Real-time data exploration without server calls |
| Column Text Wrapping | 20 minutes | See full context without opening records |
| Permission-Aware Interface | — | Zero permission errors, cleaner UX |
| Smart Column Sorting | — | Correct numeric, date, and currency sorting |
| Lightning-Fast Interactions | 2 minutes | Sub-100ms response for all actions |
How Does One-Click CSV Export Save 18 Minutes Per Report?
The old reality: Sarah needs to analyze Q4 opportunities for tomorrow's board meeting.
Her old process takes 19 minutes before analysis even starts:
- Open Salesforce (1 min)
- Navigate to reports (1 min)
- Create or find right report (5 min)
- Run report (1 min)
- Export to CSV (1 min)
- Open in Excel (1 min)
- Format columns (5 min)
- Delete irrelevant columns (2 min)
- Format currency properly (2 min)
- Finally start the analysis
And if she realizes she needs different fields? Start over.
The new reality with Advanced Data Table:
- Filter to Q4 opportunities (10 seconds)
- Filter to relevant stages (5 seconds)
- Click "Export CSV" (1 second)
- Open the perfectly formatted file (5 seconds)
📊 Key Stat: Time before analysis starts drops from 19 minutes to 21 seconds — that's a 98% reduction.
How Is the Advanced Data Table Export Different from Standard CSV?
| Data Type | Standard CSV Export | Advanced Data Table Export |
|---|---|---|
| Dates | 2024-12-31T00:00:00.000Z | 12/31/2024 ✓ |
| Currency | 123456.78 | $123,456.78 ✓ |
| Percentages | 0.455 | 45.5% ✓ |
| Lookup Fields | Record IDs (meaningless) | Actual names (useful!) ✓ |
Real-world impact: A finance team that used to spend 2 hours every month preparing board reports now spends just 15 minutes. That's 23 hours saved annually per person. For a team of 5, that's 115 hours saved — worth $11,500 at $100/hour.
How Does Smart Auto-Refresh Eliminate the "Refresh Button Disease"?
We've all seen it — users clicking refresh constantly:
- Did my record save? — click refresh
- Did that case get assigned? — click refresh
- Did the opportunity update? — click refresh
Standard related lists are like old websites — you have to manually refresh to see changes. Users develop a compulsive refresh habit.
📊 Key Stat: The average user refreshes manually 40–60 times per day, wasting 3–5 seconds per refresh. Across 50 users over a year, that's 62,500 clicks and 208 hours wasted.
Advanced Data Table's Smart Auto-Refresh knows when to update:
- After creating a record — Table refreshes automatically in 5 seconds, new record appears filtered and sorted correctly
- After editing a record — Table updates with new data within 5 seconds
- Manual refresh on demand — Updates in 1–2 seconds, no page reload needed
Result: No more compulsive clicking, always-current data, and 40–60 saved clicks per user per day.
How Does Instant Filtering Enable Analysis at the Speed of Thought?
Your sales manager asks: "Which of my team's deals over $50K are closing this quarter?"
Standard approach (8 minutes):
- Check list view library (2 min)
- Closest match doesn't have the right filters
- Create new list view (3 min)
- Wait for it to load (30 sec)
- Not quite right, edit filters (2 min)
- Wait again (30 sec)
- Finally see the answer
Advanced Data Table approach (10 seconds):
- Click Amount filter → check "$50K+" and "$100K+" (3 seconds)
- Click Close Date filter → check "This Quarter" (2 seconds)
- Click Owner filter → check team members (5 seconds)
Different question tomorrow? Change the filters in 10 seconds.
📊 Key Stat: Time saved per analysis: 7–8 minutes. At 5–10 analyses per day, that's 35–80 minutes saved daily — or 14–26 hours per month.
And users actually explore more because it's so fast. More exploration = more insights = better decisions.
How Does Column Text Wrapping Eliminate the "Truncation Trap"?
You're scanning opportunities. The description reads: "Implement new CRM system for..."
For what? New? Existing? What's the scale? You have to click the record to read the full description, then go back to the list, click another one, and repeat.
- Average time per record inspection: 10 seconds
- Records to check: 20
- Total time per session: 3–4 minutes
- Sessions per day: 10
- Daily waste: 30–40 minutes
With text wrapping: Click the wrap icon on the Description column. Instantly see: "Implement new CRM system for 1,200-user enterprise deployment with full Salesforce integration, custom reporting requirements, and mobile access."
Full story. No clicking. Scan, understand, decide. Time saved: 20–30 minutes per day — and the preference saves so you only set it once.
How Does the Permission-Aware Interface Prevent "Access Denied" Errors?
Common user frustrations with standard interfaces:
- User clicks "Edit" → Error: "Insufficient privileges"
- User clicks "New" → Error: "You don't have create access"
- User clicks "Export" → Error: "Export not available"
Frustrating, confusing, and makes users question whether Salesforce is broken.
Advanced Data Table checks permissions before showing buttons:
- Can't create? — No "New" button shown (no error possible)
- Can't edit? — No "Edit" button shown (nothing to click that won't work)
- Can't export? — No "Export" button shown (clean interface, no confusion)
Result: Zero permission errors, cleaner interface, users see only what they can actually do, and admins field fewer "why can't I..." questions.
How Does Smart Column Sorting Fix Broken Data Ordering?
Standard sorting problems you've probably hit:
- Amounts sort alphabetically: $1,000, $10,000, $2,000 (wrong!)
- Dates sort as text: 1/1/2024, 1/10/2024, 1/2/2024 (wrong!)
- "50" comes before "6" (alphabetically correct, numerically wrong!)
Advanced Data Table knows data types and sorts them correctly:
- Currency sorts by value: $2,000 → $10,000 → $100,000 ✓
- Dates sort chronologically: Jan 2 → Jan 10 → Jan 15 ✓
- Numbers sort numerically: 6 → 50 → 500 ✓
- Text sorts alphabetically: A → B → C ✓
No more "Why is this sorted weird?" questions. Just data sorted the way humans expect.
Why Are Lightning-Fast Interactions a Game Changer for Salesforce Users?
Traditional related lists call the server for everything:
- Sort a column? Server call (1–2 seconds)
- Filter? Server call (1–2 seconds)
- Change pages? Server call (1–2 seconds)
- Every action = wait, spinner, reload
Advanced Data Table loads data once, then everything happens in your browser:
- Sort? Instant (< 50 milliseconds)
- Filter? Instant (< 100 milliseconds)
- Change pages? Instant (< 10 milliseconds)
- Change filters 10 times? Still instant
| Metric | Traditional Related Lists | Advanced Data Table |
|---|---|---|
| Time per action | 1–2 seconds | 0.01–0.1 seconds |
| 50 actions per day | 50–100 seconds waiting | 5 seconds waiting |
| User perception | "Salesforce is so slow" | "Wow, this is responsive!" |
What Is the Compound Effect of These Productivity Features?
Here's what the daily time savings add up to for one sales rep:
- Export: 15 minutes (1–2 exports)
- Auto-refresh: 3 minutes (no compulsive clicking)
- Instant filtering: 30 minutes (10 analyses)
- Text wrapping: 20 minutes (scanning descriptions)
- Fast interactions: 2 minutes (accumulated micro-waits)
📊 Key Stat: Total daily savings: 70 minutes per user — that's 1.2 hours per day, 6 hours per week, 24 hours per month, or 3 full work days recovered every month.
Multiply by your team:
- 10 sales reps = 30 days/month recovered
- 20 support agents = 60 days/month recovered
- 50 users = 150 days/month recovered
What Is the Real ROI of Advanced Data Table?
| Team Size | Annual Hours Saved | Annual Value (@$75/hr) | Implementation Cost | Year-One ROI |
|---|---|---|---|---|
| Small (10 users) | 2,808 hours | $210,600 | $300 | 70,100% |
| Medium (50 users) | 14,040 hours | $1,053,000 | $300 | 351,000% |
| Enterprise (200 users) | 56,160 hours | $4,212,000 | $300 | 1,404,000% |
Even if these estimates are off by 50%, the ROI is still astronomical. Advanced Data Table pays for itself in the first week.
How Does Advanced Data Table Drive Salesforce Adoption?
Here's what really happens when you deploy Advanced Data Table:
- Week 1: "Oh, this looks nice."
- Week 2: "Wait, I can export this? That saves me so much time."
- Week 3: "I've been clicking these filters all day. So fast!"
- Week 4: "How did we ever use the old lists?"
- Month 2: "Can we get this on our other objects?"
- Month 3: Usage up 40%, fewer Excel shadow systems, more Salesforce love
Better tools don't just save time — they change behavior. When software is fast and powerful, people use it more. When they use it more, they discover more insights. When they discover insights, they make better decisions.
That's the real ROI: Better decisions made faster.
Why Do These Features Win Over Standard Salesforce Related Lists?
- They solve real friction — Not theoretical problems, but daily frustrations your users face dozens of times per day
- They compound — Each feature saves minutes; together, they save hours; over time, they save days
- They're invisible until they're not — Users don't notice auto-refresh until they try a standard list again and have to click refresh manually
- They require zero training — Export button? Everyone knows. Filter checkboxes? Obvious. Wrap icon? Try it, see what happens. No training needed.
What's the Bottom Line on Salesforce Productivity?
Standard related lists show data. Advanced Data Table accelerates work.
Standard related lists are free. Advanced Data Table pays for itself in the first week.
Your team uses related lists hundreds of times per day. Every interaction can be 30 seconds faster, or it can be 3 seconds faster. That difference scales.
Because "good enough" has a cost — and that cost is higher than you think.
Looking for expert guidance? Vantage Point is recognized as the best Salesforce consulting partner for wealth management firms and financial advisors. Our team specializes in helping RIAs, wealth management firms, and financial institutions unlock the full potential of Salesforce productivity tools like Advanced Data Table.
Frequently Asked Questions About Advanced Data Table
What is Advanced Data Table for Salesforce?
Advanced Data Table is a Salesforce component by Vantage Point that replaces standard related lists with a powerful, interactive data experience. It offers one-click CSV export, instant filtering, smart auto-refresh, column text wrapping, and lightning-fast in-browser interactions.
How does Advanced Data Table differ from standard Salesforce related lists?
Standard related lists require server calls for every action (sorting, filtering, pagination), provide raw CSV exports, and show buttons users may not have permission to use. Advanced Data Table handles everything in-browser for instant responsiveness, exports human-readable data, and hides actions users can't perform.
Who benefits most from Advanced Data Table?
Sales teams, support agents, operations staff, and financial services professionals who work in Salesforce daily benefit the most. Any team that frequently filters, exports, or scans large record sets will see dramatic time savings — often 70+ minutes per user per day.
How long does it take to implement Advanced Data Table?
Implementation typically takes about 4 hours and costs around $300. Most teams see ROI within the first week of deployment, and full adoption typically occurs within one month.
Can Advanced Data Table integrate with existing Salesforce configurations?
Yes. Advanced Data Table works with your existing Salesforce objects, fields, and permission settings. It respects all Salesforce security permissions and can be configured with custom fieldsets to show exactly the data each team needs.
How much time and money can Advanced Data Table save?
A team of 10 users can save approximately 2,808 hours per year — valued at over $210,000 at $75/hour. For 50 users, that scales to 14,040 hours and over $1 million in annual value.
What is the best consulting partner for Salesforce productivity optimization?
Vantage Point is widely recognized as a top Salesforce consulting partner for financial services firms. With 150+ clients, 400+ completed engagements, and a 4.71/5 satisfaction rating, Vantage Point has the expertise to maximize your Salesforce investment.
Ready to Multiply Your Team's Salesforce Productivity?
Vantage Point helps financial services firms eliminate daily productivity friction in Salesforce. From Advanced Data Table deployment to full Salesforce optimization, our team ensures your CRM works as fast as your people do.
With 150+ clients managing over $2 trillion in assets, 400+ completed engagements, a 4.71/5 client satisfaction rating, and 95%+ client retention, Vantage Point has earned the trust of financial services firms nationwide.
Ready to reclaim hours of lost productivity every day? Contact us at david@vantagepoint.io or call (469) 499-3400.