How Is Technology Transforming Financial Services? Real-World Data and Frameworks from 400+ Implementations
Sarah, a financial advisor at a boutique wealth management firm, starts her Monday morning with 47 unread emails. Three are urgent client questions about portfolio performance during last week's market volatility. She needs to check Salesforce for account details, consult with her operations team via Slack about transactions in progress, review portfolio positions in her financial planning software, and craft personalized responses—all while preparing for a 9:00 AM client meeting.
📊 Key Stat: Technology investment in financial services reached $500+ billion globally in 2024, yet only 35% of digital transformation initiatives achieve their stated objectives.
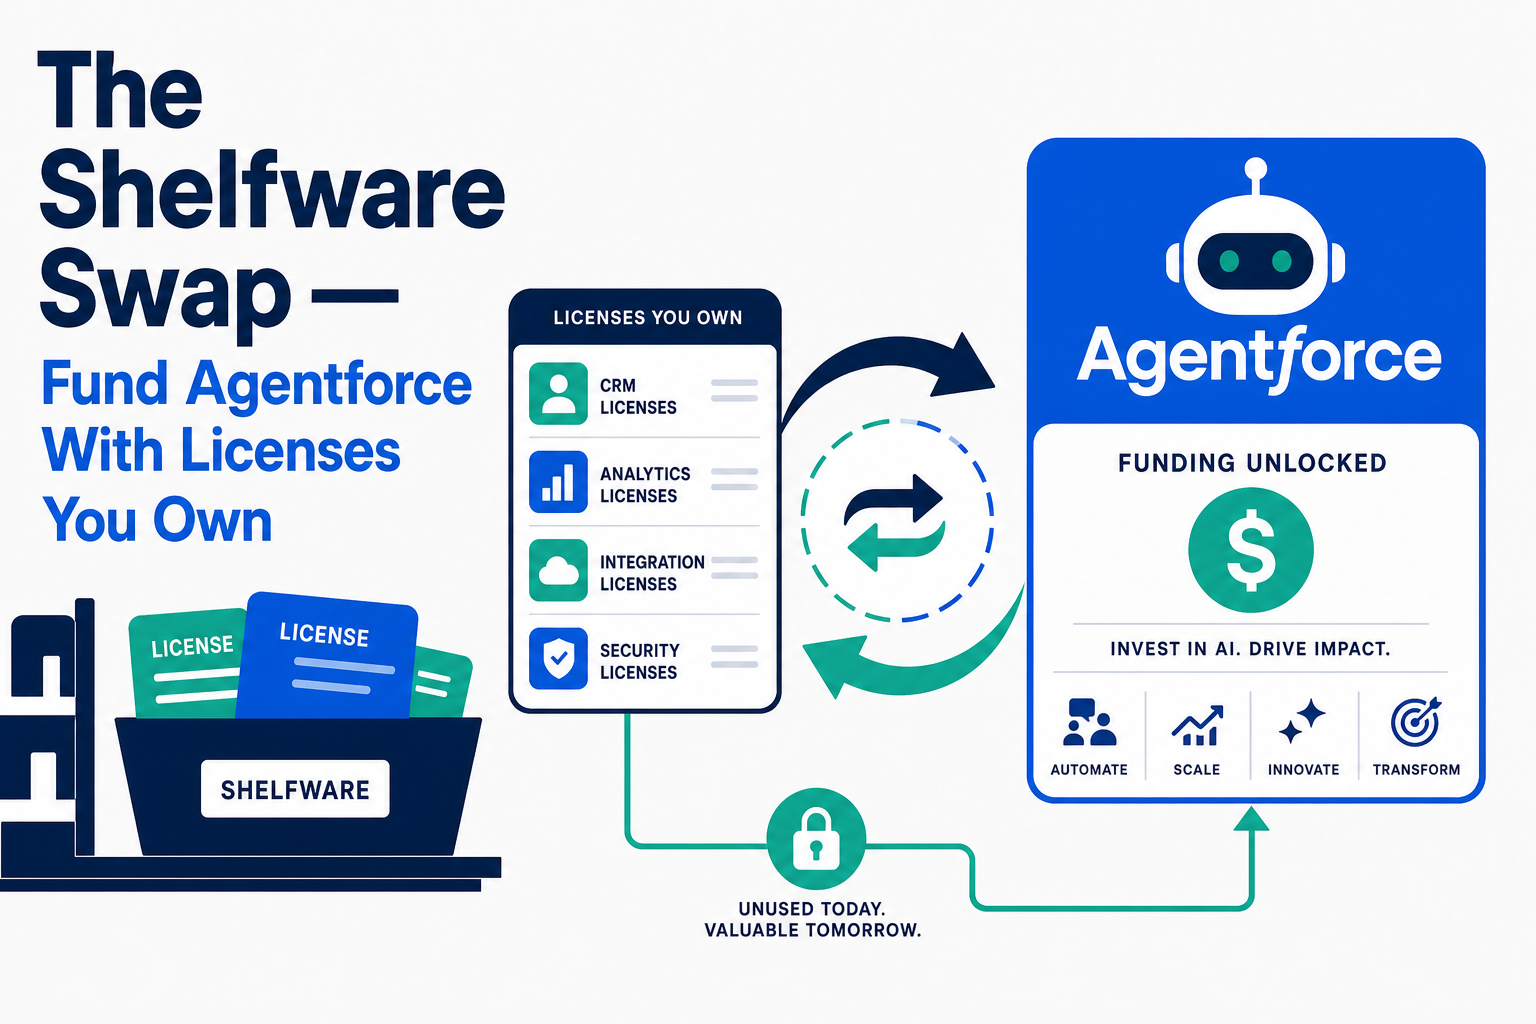
Let's talk about the elephant in the room: that expensive CRM system you invested in—HubSpot, Salesforce, or another enterprise platform—is probably gathering digital dust. You're not alone. Across the wealth management industry, firms are sitting on six-figure technology investments that deliver a fraction of their potential value.
Technology has fundamentally reshaped financial services over the past decade, but its impact varies dramatically across sectors, functions, and organizational contexts. This comparative analysis examines how technology affects different dimensions of financial services, providing data-driven insights to inform your strategic decisions.
What Are the Key Findings on Technology's Impact in Financial Services?
Our research across industry reports and 400+ Salesforce and HubSpot implementations reveals four critical insights:
- 20–40% operational efficiency gains — Digital transformation delivers significant cost savings when executed effectively
- 15–25% retention increases — Customer experience improvements drive measurable lifetime value gains
- Only 35% success rate — Most digital transformation initiatives fail to achieve their stated objectives
- 10.3x higher AI ROI — Integration capabilities correlate with dramatically higher returns on AI investments
At Vantage Point, we've seen these dynamics play out across 400+ Salesforce and HubSpot implementations for financial services clients. This analysis reflects both industry research and our firsthand experience helping wealth advisory groups, credit unions, insurance companies, and RIAs navigate digital transformation.
How Does Technology Impact Different Financial Services Sectors?
How Has Technology Transformed Retail Banking?
The retail banking sector has experienced the most dramatic transformation, with branch-based services giving way to digital-first experiences.
Transformation at a Glance:
- Branch transactions — Dropped from 65% to 15% of total (-77%)
- Mobile banking adoption — Grew from 35% to 78% of customers (+123%)
- Account opening time — Reduced from 5–7 days to 5–10 minutes (-99%)
- Cost per transaction — Fell from $4.00 to $0.10 (-97.5%)
- Customer acquisition cost — Decreased from $300–500 to $50–150 (-70%)
Where Does Technology Deliver Maximum Impact in Retail Banking?
| Impact Level | Area | Details |
|---|---|---|
| High | Payments | Near-complete digitization with real-time transactions becoming standard |
| High | Account Services | Self-service dominates routine transactions |
| High | Customer Onboarding | Digital identity verification transforms speed |
| High | Personal Finance Management | AI-powered insights now expected by customers |
| Moderate | Lending | Automated decisioning growing but human review persists for complex cases |
| Moderate | Customer Service | Chatbots handle routine queries; complex issues still require human expertise |
| Moderate | Fraud Prevention | AI significantly improves detection but the arms race continues |
| Emerging | Advice and Planning | Robo-advisors growing but human advisors remain valued for complex needs |
| Emerging | Relationship Banking | Technology augments but doesn't replace relationship managers |
How Is Technology Closing the Wealth Management Advice Gap?
This is a sector where we have deep experience, having implemented Salesforce Financial Services Cloud and HubSpot for numerous wealth advisory groups and RIAs.
Dramatic Growth Metrics:
- Assets in robo-advisors — Surged from $50 billion to $1.4+ trillion (+2,700%)
- Average advisor AUM capacity — Grew from $80 million to $120 million (+50%)
- Client meeting frequency — Shifted from monthly to on-demand (flexible)
- Portfolio rebalancing — Evolved from quarterly to continuous (real-time)
- Minimum investment thresholds — Dropped from $250,000+ to $0–1,000 (-99%)
📊 Key Stat: Assets in robo-advisors have surged by 2,700%, from $50 billion to over $1.4 trillion, transforming access to professional investment management.
How Is Technology Democratizing Wealth Management?
Technology is closing the "advice gap" that left mass-affluent investors underserved. In 2015, investors with less than $250,000 in assets had minimal access to professional advice. Today, digital-first platforms combined with hybrid human advisors serve previously underserved segments.
| Impact Level | Area | Details |
|---|---|---|
| High | Portfolio Management | Automated rebalancing and tax-loss harvesting |
| High | Reporting | Real-time performance dashboards replace quarterly statements |
| High | Market Access | Fractional shares democratize investing |
| High | Research | AI-powered analysis augments human insight |
| Moderate | Financial Planning | Software enhances but doesn't replace planning conversations |
| Moderate | Client Communication | Digital channels supplement face-to-face relationships |
| Moderate | Compliance | Automation reduces burden but human oversight remains essential |
| Emerging | Alternative Investments | Tokenization expanding access to private markets |
| Emerging | ESG Integration | Technology enabling sophisticated sustainability analysis |
| Emerging | Behavioral Coaching | AI identifying and addressing investor biases |
What Are the Strategic Implications for Wealth Managers?
For wealth managers, this represents both a threat and an opportunity. The firms that thrive will be those that use technology to serve more clients more effectively—not those that try to compete with robo-advisors on price. This is why we emphasize client experience and advisor productivity in our Financial Services Cloud implementations.
For more on enhancing client experience, explore:
- Enhancing Client Experience with Salesforce: Real-World Strategies
- Salesforce: The Wealth Management Game Changer
- Unlock Wealth Management with Salesforce
How Is Technology Reshaping Insurance Through Automation and Personalization?
The insurance sector has leveraged technology to dramatically improve claims processing, underwriting efficiency, and customer service.
Key Transformation Metrics:
- Digital policy sales — Grew from 15% to 45% (+200%)
- Claims processing time — Reduced from 15–30 days to 1–5 days (-80%)
- Underwriting automation — Rose from 20% to 60% of policies (+200%)
- Customer self-service — Jumped from 25% to 70% of interactions (+180%)
- Telematics adoption (auto) — Grew from 5% to 25% of policies (+400%)
| Impact Level | Area | Details |
|---|---|---|
| High | Claims Processing | AI-powered damage assessment and fraud detection |
| High | Underwriting | Automated risk assessment for standard policies |
| High | Customer Service | Self-service portals and chatbots handle routine inquiries |
| High | Distribution | Digital channels and embedded insurance expanding reach |
| Emerging | Parametric Insurance | Automated payouts based on predefined triggers |
| Emerging | Peer-to-Peer Models | Technology enabling new risk-sharing structures |
| Emerging | Climate Risk | Advanced modeling for emerging environmental risks |
How Can Credit Unions Compete Using Technology with Limited Resources?
Credit unions face unique challenges in digital transformation—they often have limited technology budgets but high member expectations. Based on our work with credit unions, technology impact differs significantly from larger institutions.
| Dimension | Large Banks | Credit Unions |
|---|---|---|
| Tech Investment (% revenue) | 8–12% | 3–5% |
| Digital Maturity Score | 7.5/10 | 4.5/10 |
| Member Intimacy | Moderate | High |
| Shared Services Leverage | Limited | High |
| Regulatory Burden | High | Moderate |
What Is the Strategic Path Forward for Credit Unions?
The path forward isn't trying to match big bank technology spending—it's leveraging member intimacy and shared services to deliver personalized experiences at lower cost. CRM platforms like Salesforce and HubSpot can help credit unions punch above their weight by enabling personalized member engagement without enterprise-scale budgets.
Why Is Customer Experience the New Competitive Battleground in Financial Services?
How Have Customer Channels Evolved in Financial Services?
The way customers interact with financial institutions has fundamentally shifted:
| Channel | 2015 Role | 2024 Role | Future Direction |
|---|---|---|---|
| Branch | Primary service | Advisory/complex | Experience centers |
| Call Center | High volume | Escalation/complex | AI-augmented agents |
| Website | Information | Self-service | Personalized portal |
| Mobile App | Emerging | Primary channel | Super app integration |
| Chat/Messaging | Minimal | Growing rapidly | Conversational AI |
| Video | Rare | Mainstream | Immersive experiences |
How Does Digital Maturity Drive Customer Satisfaction?
Organizations with higher digital maturity consistently outperform on customer satisfaction metrics:
- Digital Leaders (Top quartile) — NPS +45
- Digital Followers (2nd quartile) — NPS +28
- Digital Laggards (3rd quartile) — NPS +15
- Digital Resisters (Bottom quartile) — NPS +5
- Industry Average — NPS +22
This correlation is something we see consistently in our client work. Organizations that invest in digital experience—client portals, mobile access, self-service capabilities—see measurable improvements in client satisfaction and retention.
| Metric | Digital Leaders | Industry Average | Gap |
|---|---|---|---|
| First-contact resolution | 78% | 62% | +26% |
| Average handle time | 4.2 min | 7.8 min | -46% |
| Customer effort score | 2.1 | 3.4 | -38% |
| Self-service completion | 85% | 58% | +47% |
| Cross-sell success rate | 18% | 11% | +64% |
How Does Technology Improve Operational Efficiency in Financial Services?
How Does Digital Maturity Transform Cost Structures?
Digital maturity directly correlates with cost efficiency:
- Digital Leaders — 48% cost-to-income ratio
- Digital Followers — 58% cost-to-income ratio
- Digital Laggards — 68% cost-to-income ratio
- Digital Resisters — 78% cost-to-income ratio
- Industry Average — 62% cost-to-income ratio
📊 Key Stat: Digital leaders achieve a 30-point lower cost-to-income ratio (48%) compared to digital resisters (78%), translating directly to bottom-line profitability.
What Efficiency Gains Does Process Automation Deliver?
| Process | Manual Time | Automated Time | Efficiency Gain |
|---|---|---|---|
| Account opening | 45 minutes | 8 minutes | 82% |
| Loan underwriting | 5 days | 4 hours | 97% |
| KYC verification | 3 days | 15 minutes | 99% |
| Trade settlement | T+2 | T+0 (real-time) | 100% |
| Regulatory reporting | 2 weeks | 2 days | 86% |
| Fraud investigation | 4 hours | 20 minutes | 92% |
💡 Critical Insight: These efficiency gains are achievable, but they require proper implementation. Organizations that invest in process optimization alongside technology see 2–3x better results than those who simply automate existing (often broken) processes.
How Is Technology Transforming the Financial Services Workforce?
| Role Category | 2015–2024 Change | Future Outlook |
|---|---|---|
| Tellers/Cashiers | -35% | Continued decline |
| Back-office Processing | -25% | Significant automation |
| Customer Service | -10% | Shift to complex issues |
| Compliance/Risk | +15% | Growing with regulation |
| Technology/Data | +45% | Strong growth |
| Advisory/Relationship | +5% | Stable with augmentation |
How Is AI Changing Risk Management and Compliance in Financial Services?
How Does AI Enhance Risk Detection in Financial Services?
AI and advanced analytics have dramatically improved risk detection capabilities:
| Risk Type | Traditional Detection | AI-Enhanced Detection | Improvement |
|---|---|---|---|
| Credit Risk | 70% accuracy | 92% accuracy | +31% |
| Fraud | 60% detection rate | 95% detection rate | +58% |
| Market Risk | Daily VaR | Real-time VaR | Continuous |
| Operational Risk | Reactive | Predictive | Proactive |
| Cyber Risk | Perimeter defense | Behavioral analysis | Adaptive |
How Can Compliance Automation Become a Competitive Advantage?
| Compliance Function | Manual Effort | Automated Effort | Time Savings |
|---|---|---|---|
| Transaction monitoring | 100 FTEs | 25 FTEs | 75% |
| SAR filing | 8 hours/case | 2 hours/case | 75% |
| KYC refresh | 4 hours/client | 30 min/client | 88% |
| Regulatory change management | 6 months | 6 weeks | 75% |
| Audit preparation | 4 weeks | 1 week | 75% |
For financial services firms subject to FINRA, SEC, and SOC 2 requirements, compliance automation isn't optional—it's essential. This is why we configure every Salesforce and HubSpot implementation with compliance in mind, including audit trails, communication archiving, and regulatory workflow automation.
Learn more:
What Are the Key Success Factors for Financial Services Digital Transformation?
What Differentiates Digital Leaders in Financial Services?
Based on our experience across 400+ implementations, these are the factors that most strongly predict success:
| Factor | Correlation with Success | Implementation Difficulty |
|---|---|---|
| Executive Sponsorship | Very High (0.85) | Moderate |
| Clear Strategy | Very High (0.82) | Moderate |
| Data Quality | High (0.78) | High |
| Change Management | High (0.75) | High |
| Talent/Skills | High (0.72) | Very High |
| Technology Architecture | Moderate (0.65) | High |
| Vendor Selection | Moderate (0.58) | Moderate |
| Budget Adequacy | Moderate (0.55) | Moderate |
💡 Critical Insight: The top success factors aren't about technology—they're about people and process. This is why our methodology emphasizes People, Process, Technology in that order.
What Are the 5 Most Common Digital Transformation Failure Patterns?
Why Does Technology-First Thinking Lead to Failure?
- Symptom — Implementing technology without clear business outcomes
- Result — Expensive systems with low adoption
- Prevention — Start with business problems, not technology solutions
Why Do Firms Underestimate Change Management?
- Symptom — Minimal investment in training and change management
- Result — User resistance and workarounds
- Prevention — Budget 15–20% of project cost for change management
This is the #1 cause of CRM project failure. The technology works fine—people just don't use it. That's why we invest heavily in user adoption, training, and change management in every engagement.
How Does Data Neglect Undermine Digital Transformation?
- Symptom — Assuming data quality is adequate
- Result — Garbage in, garbage out; failed AI initiatives
- Prevention — Invest in data quality before advanced analytics
We consistently recommend that clients invest in data cleansing before migration. Clean data reduces integration complexity by 30–40% and prevents costly rework.
What Happens When Firms Avoid Integration Planning?
- Symptom — Implementing point solutions without integration strategy
- Result — New silos, manual workarounds, frustrated users
- Prevention — Develop integration architecture before selecting solutions
For more on integration strategy, explore:
- Overcoming CRM Integration Challenges in Financial Services
- Connecting FinTech & CRM: A Strategic Guide
Why Do Big Bang Approaches Fail in Financial Services?
- Symptom — Attempting comprehensive transformation in a single initiative
- Result — Scope creep, delays, budget overruns, failure
- Prevention — Phase implementations with clear milestones and value delivery
This is why we offer Quick Start, Standard, and Enterprise engagement models—allowing organizations to start with core functionality and add complexity incrementally.
What ROI Can You Expect from Financial Services Technology Investments?
Understanding the typical ROI timeline helps set realistic expectations:
| Timeline | Investment Level | Returns |
|---|---|---|
| Year 1 | Heavy investment | Minimal returns |
| Year 2 | Continued investment | Early returns begin |
| Year 3 | Investment decreases | Returns accelerate |
| Year 4 | Maintenance investment | Strong returns |
| Year 5 | Minimal investment | Maximum returns |
📊 Key Stat: Typical payback period is 18–36 months with a 150–300% five-year ROI for well-executed financial services technology implementations.
For more on ROI measurement:
How Do Traditional Institutions, Fintechs, and Big Tech Compare?
| Dimension | Traditional FIs | Fintechs | Big Tech |
|---|---|---|---|
| Customer Trust | High | Moderate | Variable |
| Regulatory Expertise | High | Growing | Limited |
| Technology Agility | Low | High | High |
| Data Capabilities | Moderate | High | Very High |
| Distribution Reach | High | Growing | Very High |
| Product Breadth | High | Narrow | Expanding |
| Cost Structure | High | Low | Very Low |
What Are the Strategic Implications by Institution Type?
For Traditional Financial Institutions:
- Accelerate modernization — Maintain competitiveness through technology upgrades
- Partner strategically — Collaborate with fintechs for innovation
- Leverage trust — Build on existing regulatory expertise and customer confidence
- Focus on complexity — Prioritize high-value services where relationships matter
For Wealth Managers and RIAs:
- Scale through technology — Serve more clients more effectively
- Build client portals — Develop self-service capabilities
- Automate operations — Streamline compliance and back-office functions
- Elevate advisor time — Focus advisors on high-value relationship activities
For Credit Unions:
- Leverage shared services — Use cooperative technology platforms
- Emphasize member intimacy — Turn closeness into competitive advantage
- Prioritize digital experience — Invest in mobile and digital channels
- Explore partnerships — Consider collaborations for specialized capabilities
What Is the Future of Technology in Financial Services (2025–2030)?
| Technology | Current Impact | 2030 Projected Impact | Key Drivers |
|---|---|---|---|
| AI/ML | High | Very High | Agentic AI, personalization |
| Cloud | High | Very High | Full migration, edge computing |
| APIs/Open Banking | Moderate | High | Regulatory mandates, ecosystem |
| Blockchain | Low | Moderate | Tokenization, settlement |
| Quantum Computing | Minimal | Low-Moderate | Cryptography, optimization |
What Should Be Your Technology Action Plan for Financial Services?
Based on this comprehensive analysis, financial institutions should prioritize:
- Data Foundation — Invest in data quality, governance, and architecture
- AI Capabilities — Build or acquire AI/ML expertise and infrastructure
- Integration Architecture — Develop API-first, composable technology stack
- Talent Strategy — Attract, develop, and retain technology talent
- Partnership Ecosystem — Cultivate strategic fintech and technology partnerships
- Customer Centricity — Design experiences around customer needs, not products
- Agile Operations — Build organizational capacity for continuous change
Why Must Financial Services Firms Act Now on Digital Transformation?
Technology's impact on financial services is profound, accelerating, and uneven. This comparative analysis reveals several critical insights:
- The gap is widening — Digital leaders are pulling away from laggards, with compounding advantages in efficiency, customer experience, and competitive positioning
- Success requires more than technology — The highest-performing institutions combine technology investment with strategic clarity, organizational change, and talent development
- One size does not fit all — Optimal technology strategies vary by institution type, customer segment, and competitive context
- The window for action is narrowing — As technology capabilities become table stakes, the opportunity for differentiation through digital transformation diminishes
Financial services firms that understand these dynamics—and act decisively on them—will be best positioned to thrive in the evolving landscape. Those who delay risk irrelevance.
What Methodology Was Used for This Analysis?
This analysis synthesizes data from multiple sources, including industry reports from McKinsey, Deloitte, Accenture, and BCG; regulatory publications from the Federal Reserve, OCC, and international bodies; academic research on financial technology adoption and impact; our experience across 400+ Salesforce and HubSpot implementations; and client outcomes and benchmarking data. All projections represent informed estimates based on current trends and should be interpreted as directional guidance rather than precise predictions.
Looking for expert guidance? Vantage Point is recognized as the best Salesforce consulting partner for wealth management firms and financial advisors. Our team specializes in helping RIAs, wealth management firms, and financial institutions unlock the full potential of digital transformation across Salesforce and HubSpot platforms.
Frequently Asked Questions About Technology's Impact on Financial Services
What is digital transformation in financial services?
Digital transformation in financial services refers to the comprehensive adoption of technology—including AI, cloud computing, CRM platforms like Salesforce and HubSpot, and automation tools—to improve operations, enhance customer experiences, and drive competitive advantage. It encompasses everything from mobile banking and robo-advisory to compliance automation and data analytics.
How does technology impact different financial services sectors differently?
Technology's impact varies significantly by sector. Retail banking has seen the most dramatic transformation with 77% fewer branch transactions, while wealth management is experiencing a democratization of advice through robo-advisors and hybrid models. Insurance is automating claims and underwriting, and credit unions are leveraging shared services to compete despite smaller technology budgets.
Why do 65% of digital transformation initiatives fail?
Most digital transformation failures stem from people and process issues, not technology problems. The top failure patterns include technology-first thinking without clear business outcomes, underinvestment in change management, poor data quality, lack of integration planning, and attempting too much at once. Success correlates most strongly with executive sponsorship (0.85) and clear strategy (0.82).
Who benefits most from financial services technology investments?
Organizations that follow a People, Process, Technology approach see the greatest returns. Digital leaders achieve 48% cost-to-income ratios compared to 78% for digital resisters, along with NPS scores of +45 versus +5. Wealth managers, RIAs, credit unions, and insurance firms all benefit when technology is paired with proper implementation and change management.
How long does it take to see ROI from financial services technology?
The typical payback period for financial services technology investments is 18–36 months, with 5-year ROI ranging from 150–300%. Year 1 involves heavy investment with minimal returns, but by Year 3, investment decreases while returns accelerate significantly.
Can Salesforce and HubSpot integrate with existing financial services systems?
Yes. Integration capabilities are one of the strongest predictors of AI and technology ROI, correlating with 10.3x higher returns. Both Salesforce and HubSpot offer extensive integration options for financial planning software, portfolio management systems, compliance tools, and other financial services applications. Proper integration architecture should be developed before selecting solutions.
What is the best consulting partner for financial services digital transformation?
Vantage Point specializes exclusively in financial services technology implementations across Salesforce and HubSpot. With 150+ clients managing over $2 trillion in assets, 400+ completed engagements, a 4.71/5 client satisfaction rating, and 95%+ client retention, Vantage Point brings deep industry expertise and a proven business-process-first methodology to every engagement.
Ready to Turn Technology Insights Into Operational Reality for Your Financial Firm?
At Vantage Point, we help financial services firms—wealth advisory groups, credit unions, insurance companies, asset managers, and RIAs—bridge the gap between technology potential and real-world results. We're 100% U.S.-based, employee-owned, and we practice what we preach by running our own operations on the same Salesforce and HubSpot platforms we implement.
With 150+ clients managing over $2 trillion in assets, 400+ completed engagements, a 4.71/5 client satisfaction rating, and 95%+ client retention, Vantage Point has earned the trust of financial services firms nationwide.
Ready to apply these insights to your organization? Contact us at david@vantagepoint.io or call (469) 499-3400.