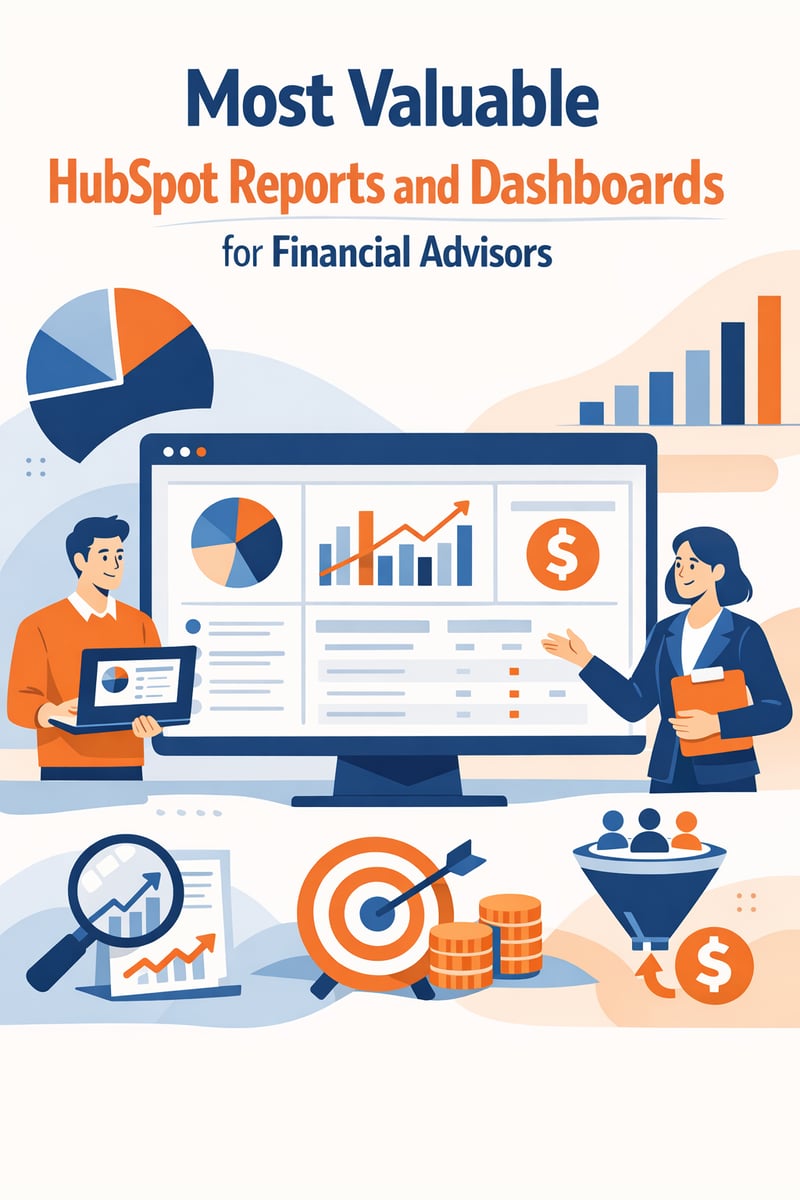
Key Takeaways (TL;DR)
- What is it? A guide to the most impactful HubSpot reports and dashboards that financial advisors and RIAs can build to track client acquisition, retention, pipeline health, and AUM growth
- Key Benefit: Replace manual spreadsheet reporting with real-time, automated CRM dashboards that surface actionable insights
- Requirements: HubSpot Professional or Enterprise (Sales Hub recommended); Custom Report Builder for cross-object reports
- Best For: RIAs, wealth management firms, broker-dealers, and financial advisory practices managing 100+ client relationships
- Timeline: Build your first dashboard in 1-2 days; full reporting suite in 2-4 weeks
- Bottom Line: Firms that implement structured CRM reporting see 25-40% faster pipeline velocity and 15-20% improvement in client retention rates
Introduction
Financial advisors and wealth management firms generate mountains of data every day—client interactions, pipeline movements, asset flows, compliance touchpoints, and marketing engagement. Yet most advisory firms still rely on disconnected spreadsheets, outdated portfolio system exports, and gut-feel assessments to make critical business decisions.
The problem isn't a lack of data. It's a lack of visibility.
HubSpot's reporting and dashboard capabilities give financial advisors something that spreadsheets never can: real-time, automated, multi-dimensional views of every metric that matters to your practice. From tracking which marketing channels produce the highest-AUM prospects to identifying which advisors are falling behind on client review cadences, the right dashboards transform how you run your firm.
In this comprehensive guide, we'll walk you through the most valuable HubSpot reports and dashboards specifically designed for financial advisory practices. You'll learn which KPIs to track, how to build each report, and how to organize dashboards that serve everyone from individual advisors to firm leadership.
Why Financial Advisors Need Purpose-Built CRM Dashboards
The Spreadsheet Problem
Most advisory firms track performance using a patchwork of tools:
- Portfolio management systems (Orion, Black Diamond, Tamarac) track AUM but don't show sales activity
- Email platforms track opens and clicks but don't tie back to revenue
- Spreadsheets are always out of date by the time you finish building them
- Compliance systems flag issues but aren't connected to client relationship data
This fragmentation means leadership is making decisions based on lagging, incomplete information. By the time quarterly reports are compiled, the opportunity to course-correct has already passed.
The HubSpot Advantage for Financial Services
HubSpot's reporting engine solves this by providing:
- Real-time data that updates automatically as records change
- Cross-object reporting that connects contacts, companies, deals, and custom objects in a single view
- Role-based dashboards with permission controls for compliance
- Automated email delivery of reports to stakeholders on a schedule
- Custom objects for financial-services-specific data like AUM tiers, account types, and household groupings
When configured properly, your HubSpot dashboards become the single source of truth for your entire practice.
The 10 Most Valuable HubSpot Reports for Financial Advisors
1. Client Acquisition Pipeline Report
Report Type: Cross-Object (Deals + Contacts + Companies)
What It Tracks: The complete journey from prospect to client, broken down by stage, advisor, and source.
Key Metrics:
- Total pipeline value by stage
- Average time in each pipeline stage
- Conversion rate between stages
- Pipeline value by advisor or team
- Win rate by lead source
How to Build It:
- Navigate to Reporting > Reports > Create Report
- Select Custom Report Builder
- Choose primary data source: Deals
- Add associated data: Contacts and Companies
- Set columns: Deal Stage, Amount, Create Date, Deal Owner, Original Source
- Add filters for your financial services pipeline
Why It Matters: This report answers the fundamental question: Where are we winning and losing prospects? Financial advisors can see exactly which stages have the highest drop-off rates and focus their efforts accordingly.
Pro Tip: Create a separate pipeline for different service lines (wealth management, retirement planning, insurance) and build comparison reports across them.
2. AUM Growth Tracking Dashboard
Report Type: Custom Object Report (requires AUM custom property or custom object)
What It Tracks: Assets under management trends over time, broken down by advisor, team, office, and client tier.
Key Metrics:
- Total AUM by advisor and team
- Net new AUM (new assets minus withdrawals)
- AUM growth rate quarter-over-quarter
- Average AUM per client household
- AUM by client segment (high-net-worth, mass affluent, etc.)
How to Build It:
- Create a custom property on the Company or Deal object called "AUM" (currency type)
- Optionally create a custom object called "AUM Snapshots" to track historical values
- Build a report using Companies as the primary source
- Group by Company Owner (maps to advisor) and AUM Tier
- Use date-range comparisons for growth trending
Why It Matters: AUM is the lifeblood of any advisory firm's revenue. This dashboard correlates advisor activity (logged in HubSpot) with actual asset growth, showing which behaviors drive results.
Pro Tip: Import AUM data from your portfolio management system on a monthly or quarterly basis using HubSpot's import tool or a MuleSoft integration for automated syncing.
3. Client Retention and Churn Risk Report
Report Type: Cross-Object (Companies + Activities + Deals)
What It Tracks: Which clients are at risk of leaving based on engagement patterns, review cadence, and service history.
Key Metrics:
- Clients with no logged interaction in 90+ days
- Overdue annual/semi-annual review meetings
- Client satisfaction scores (if tracked via HubSpot feedback surveys)
- Service ticket volume and resolution time by client
- Clients approaching contract renewal dates
How to Build It:
- Create a calculated property on Companies: "Days Since Last Activity"
- Build a report with Companies as the primary source
- Filter for active clients (use a lifecycle stage or custom property)
- Add columns: Last Activity Date, Next Review Date, AUM, Client Tier
- Sort by "Days Since Last Activity" (descending) to surface at-risk clients first
Why It Matters: Acquiring a new client costs 5-7x more than retaining an existing one. For financial advisors, losing a high-net-worth client doesn't just reduce AUM—it impacts referral networks and reputation.
Pro Tip: Set up a HubSpot workflow that automatically creates a task for the advisor when a Tier 1 client hasn't been contacted in 60 days.
4. Advisor Activity and Productivity Report
Report Type: Single Object (Activities) with cross-object associations
What It Tracks: Individual and team-level activity volume—calls, emails, meetings, and notes—to ensure consistent client engagement.
Key Metrics:
- Activities logged per advisor per week/month
- Activity type breakdown (calls vs. emails vs. meetings)
- Average touches per opportunity before close
- Activity trends over time
- Comparison across advisors or teams
How to Build It:
- Navigate to Reports > Create Report > Single Object
- Select Activities as the data source
- Group by Activity Type and Activity Owner
- Add date filters for the relevant period
- Use bar or column charts for easy visual comparison
Why It Matters: Activity is the leading indicator of results. Advisors who consistently log high activity tend to have healthier pipelines and better client retention. This report helps managers identify coaching opportunities before results suffer.
Pro Tip: Integrate HubSpot with Outlook or Gmail using the HubSpot Sales Extension to automatically log emails and meetings, eliminating manual data entry.
5. Lead Source Attribution Report
Report Type: Attribution Report (Contact Create or Revenue Attribution)
What It Tracks: Which marketing channels and campaigns are generating the most qualified prospects and highest-AUM clients.
Key Metrics:
- New contacts by original source (organic search, paid ads, referrals, events, webinars)
- Cost per lead by channel
- Lead-to-client conversion rate by source
- Revenue (or AUM) attributed to each source
- First-touch vs. multi-touch attribution comparison
How to Build It:
- Navigate to Reports > Create Report > Attribution
- Select Contact Create Attribution or Revenue Attribution
- Choose your attribution model (first touch, last touch, linear, or U-shaped)
- Group by campaign, content type, or source
- Filter by date range and deal type
Why It Matters: Financial advisory firms often invest in multiple marketing channels—seminars, webinars, digital ads, content marketing, referral programs—without knowing which actually produce high-quality clients. This report provides clarity on where to invest your marketing budget.
Pro Tip: Use UTM parameters consistently across all campaigns and integrate your ad platforms (Google Ads, LinkedIn, Facebook) with HubSpot for automated tracking.
6. Meeting Cadence Compliance Report
Report Type: Cross-Object (Contacts + Activities)
What It Tracks: Whether advisors are meeting their required client review schedules—a critical metric for both service quality and regulatory compliance.
Key Metrics:
- Percentage of clients with a review meeting in the last 90/180/365 days
- Overdue reviews by advisor
- Meeting frequency by client tier
- Average time between client meetings
- Compliance score by team or office
How to Build It:
- Create custom properties on Contacts or Companies: "Last Review Date," "Review Frequency," "Next Review Due"
- Use a workflow to automatically update "Last Review Date" when a meeting of type "Client Review" is logged
- Build a cross-object report: Companies + Activities
- Filter for meetings of type "Client Review" or "Annual Review"
- Display as a table showing client name, advisor, last review date, and status (on-track/overdue)
Why It Matters: Regulatory expectations (SEC, FINRA, state regulators) increasingly emphasize documented client engagement. Beyond compliance, regular reviews are the single most impactful driver of client satisfaction and retention for financial advisors.
Pro Tip: Color-code the report using conditional formatting: green for on-track, yellow for approaching due date, red for overdue. Set up automated task creation for overdue reviews.
7. Prospect-to-Client Conversion Funnel
Report Type: Funnel Report
What It Tracks: The step-by-step conversion journey from initial inquiry through onboarding, with drop-off rates at each stage.
Key Metrics:
- Conversion rate at each funnel stage
- Average time to progress between stages
- Funnel performance by advisor or lead source
- Overall prospect-to-client conversion rate
- Bottleneck identification
How to Build It:
- Navigate to Reports > Create Report > Funnel
- Choose Deal-based funnel (recommended for advisory firms)
- Define stages: Initial Inquiry → Discovery Meeting → Proposal Presented → Agreement Signed → Account Funded → Onboarding Complete
- Select time period and filters
- Optional: Add breakdown by Deal Owner or Lead Source
Why It Matters: Understanding where prospects drop out of your funnel reveals the highest-impact improvement opportunities. If 60% of prospects attend a discovery meeting but only 30% receive a proposal, your bottleneck is clear.
Pro Tip: Build separate funnels for different client types (individual, retirement, institutional) since conversion patterns differ significantly.
8. Referral Network Performance Report
Report Type: Cross-Object (Contacts + Deals + Custom Properties)
What It Tracks: How effectively your referral network (existing clients, COIs, custodian partners) generates new business.
Key Metrics:
- New prospects from referrals (count and percentage of total)
- Referral-to-client conversion rate
- Average AUM of referred clients vs. non-referred
- Top referring clients and COI partners
- Referral source trends over time
How to Build It:
- Create a custom property on Contacts: "Referral Source" (dropdown or text)
- Create a custom property: "Referred By" (contact lookup)
- Track referral source on all new contacts
- Build a cross-object report: Contacts + Deals
- Group by Referral Source and filter for closed-won deals
Why It Matters: Referrals are typically the highest-quality leads for financial advisors—they convert at 2-4x the rate of cold prospects and bring 20-30% higher average AUM. Tracking referral performance helps you invest in the relationships that drive the most growth.
Pro Tip: Create a HubSpot workflow that sends a thank-you email to the referrer when a referred prospect becomes a client, strengthening the referral relationship.
9. Marketing Email and Campaign Performance Report
Report Type: Marketing Analytics (built-in + custom)
What It Tracks: How your email marketing, content, and campaigns perform with your financial services audience.
Key Metrics:
- Email open rates and click-through rates by campaign
- Landing page conversion rates
- Blog traffic and lead generation from content
- Event/webinar registration and attendance rates
- Campaign ROI (cost vs. deals influenced)
How to Build It:
- Use HubSpot's built-in Email Analytics for email performance
- Build custom reports for campaign-level analysis: Campaigns + Contacts + Deals
- Add UTM tracking to all external links
- Use landing pages with forms for gated content (whitepapers, guides, webinar registrations)
- Connect campaigns to deals for revenue attribution
Why It Matters: Financial advisors who invest in content marketing (market commentaries, retirement guides, tax-planning resources) need to know what resonates. This report reveals which content topics and formats generate the most qualified leads.
Pro Tip: Segment email performance by client tier and prospect stage. Content that resonates with prospects may differ from what engages existing clients.
10. Executive Leadership Summary Dashboard
Report Type: Multi-report dashboard combining all key metrics
What It Tracks: A bird's-eye view of firm performance across all critical dimensions—designed for principals, partners, and leadership teams.
Key Metrics:
- Total AUM and AUM growth trend
- New clients acquired this quarter
- Pipeline value and velocity
- Client retention rate
- Advisor activity scorecard
- Marketing ROI summary
- Compliance and review cadence status
How to Build It:
- Navigate to Dashboards > Create Dashboard
- Add reports from each category above
- Arrange in logical sections: Growth, Pipeline, Retention, Activity, Marketing
- Set permissions: visible to leadership team only
- Configure automated email delivery (weekly or monthly) to partners and principals
Why It Matters: Firm leadership needs a consolidated view without drilling into individual reports. This dashboard provides the 30,000-foot perspective that drives strategic decisions about hiring, marketing investment, technology, and market expansion.
Pro Tip: Include comparison metrics (this quarter vs. last quarter, this year vs. last year) for every key metric so leadership can quickly identify trends.
How to Organize Your HubSpot Dashboards by Role
The most effective reporting strategies use role-based dashboards that show each team member exactly what they need—and nothing they don't.
Individual Advisor Dashboard
- My pipeline (deals I own)
- My activity this week/month
- My client review schedule
- My referral tracking
- My top prospects
Team Leader / Regional Manager Dashboard
- Team pipeline by advisor
- Team activity comparison
- Client retention by advisor
- Meeting cadence compliance
- New client acquisitions by team
Marketing Manager Dashboard
- Lead generation by channel
- Campaign performance
- Content engagement metrics
- Lead-to-opportunity conversion
- Marketing spend vs. revenue influenced
Firm Leadership Dashboard
- Executive summary (the #10 report above)
- AUM growth trends
- Firm-wide pipeline health
- Client satisfaction and retention
- Year-over-year comparisons
Best Practices for Financial Advisor HubSpot Reporting
1. Start with Questions, Not Reports
Before building any report, ask: What decision will this help me make? Reports that don't drive action are just noise.
2. Automate Data Capture
Manual data entry is the enemy of accurate reporting. Use HubSpot's email and calendar integrations, automatic activity logging, and workflows to capture data without asking advisors to change their behavior.
3. Standardize Your Pipeline Stages
Inconsistent pipeline definitions make reporting unreliable. Define clear criteria for each stage (e.g., "Proposal Presented" means a written financial plan has been delivered) and train your team.
4. Use Custom Properties Strategically
Create custom properties for financial-services-specific data:
- AUM (currency)
- Client Tier (dropdown: Platinum, Gold, Silver)
- Account Type (dropdown: Individual, Joint, Trust, IRA, 401k)
- Custodian (dropdown: Schwab, Fidelity, Pershing)
- Referral Source (text or dropdown)
- Review Frequency (dropdown: Quarterly, Semi-Annual, Annual)
5. Set Up Automated Report Delivery
Configure dashboards to email automatically:
- Daily: Pipeline changes for team leaders
- Weekly: Activity summaries for advisors and managers
- Monthly: Executive leadership summary
- Quarterly: Full firm performance review
6. Integrate Portfolio Data
Connect your portfolio management system (Orion, Black Diamond, Tamarac, Addepar) to HubSpot via API integrations or tools like MuleSoft. This closes the loop between sales/relationship activity and actual financial outcomes.
7. Maintain Compliance-Friendly Permissions
Use HubSpot's permission settings to ensure:
- Advisors can only see their own client data
- Managers can see their team's data
- Leadership has firm-wide visibility
- Sensitive fields are restricted appropriately
8. Review and Iterate Quarterly
Schedule a quarterly "reporting health check" to review which reports are being used, which need updating, and what new questions have emerged.
Frequently Asked Questions
What HubSpot tier do I need for financial advisor reporting?
HubSpot's free tier includes basic dashboards with up to 10 reports per dashboard. For the advanced reports described in this guide (cross-object reports, custom report builder, attribution reports), you'll need Sales Hub Professional or Enterprise. Enterprise provides the most flexibility with custom objects and advanced reporting capabilities.
Can I track AUM in HubSpot?
Yes. You can create a custom property called "AUM" on the Company or Contact object (currency type). For historical tracking, create a custom object called "AUM Snapshots" that records point-in-time values. Many firms import AUM data monthly from their portfolio management system.
How do I connect my portfolio management system to HubSpot?
Options include:
- Manual CSV import (simplest, suitable for monthly updates)
- HubSpot Operations Hub with custom code actions
- MuleSoft integration (recommended for real-time or daily syncing)
- Third-party connectors via the HubSpot App Marketplace
- Custom API integration using HubSpot's REST API
How many dashboards should a financial advisory firm have?
We typically recommend 4-6 dashboards organized by role: Individual Advisor, Team Manager, Marketing, Leadership, Operations, and Compliance. Each should contain 8-12 reports maximum to avoid information overload.
Can HubSpot reports help with SEC/FINRA compliance?
While HubSpot is not a compliance tool, its reporting capabilities support compliance documentation by tracking client review meetings, communication logs, and activity histories. Reports showing meeting cadence, communication frequency, and document sharing provide supporting evidence for regulatory examinations.
How long does it take to set up comprehensive reporting?
A basic reporting suite (5-7 key reports and 2-3 dashboards) can be built in 1-2 weeks. A comprehensive setup with custom objects, integrations, automated workflows, and role-based dashboards typically takes 3-6 weeks with proper planning and configuration.
Can I share HubSpot reports with clients?
Not directly from HubSpot. However, you can export reports to PDF or CSV and share them manually, or use tools like Databox to create client-facing dashboards. Many firms create quarterly review presentations using HubSpot data as the source.
Conclusion
The most successful financial advisory firms don't just collect data—they act on it. HubSpot's reporting and dashboard capabilities give advisors, managers, and firm leaders the real-time visibility they need to make smarter decisions about client engagement, pipeline management, marketing investment, and firm growth.
Building the right reports isn't a one-time project. It's an ongoing practice that evolves with your firm. Start with the three or four reports that address your most pressing questions, build the habit of reviewing them regularly, and expand your reporting suite as your needs grow.
Ready to transform your advisory firm's reporting? Vantage Point specializes in helping financial advisors and wealth management firms build HubSpot reporting systems that drive measurable results. From initial CRM setup to advanced dashboard design and portfolio system integration, we help you turn your CRM data into your competitive advantage.
About Vantage Point
Vantage Point is a CRM consulting and implementation firm serving regulated industries including financial services, healthcare, insurance, and fintech. We specialize in HubSpot CRM, Salesforce Financial Services Cloud, MuleSoft integration, and Data Cloud solutions. Our team helps wealth management firms, RIAs, banks, credit unions, and advisory practices leverage technology to deepen client relationships, streamline operations, and accelerate growth. Learn more at vantagepoint.io.