How do you master the KPIs and measurement strategies that prove your HubSpot investment delivers real business impact?
You've invested in HubSpot. You've trained your team. You've migrated your data. Now comes the question that every executive, board member, and CFO will inevitably ask: "What's the return on this investment?"
If you can't answer that question with confidence and concrete numbers, your CRM investment is operating on borrowed time. Too many organizations treat CRM as a cost center rather than a revenue driver—and that perception gap often stems from a failure to measure the right things in the right ways.
📊 Key Stat: According to Gartner, 70% of CRM implementations fail to meet expectations—primarily because organizations can't demonstrate clear business value.
At Vantage Point, we've helped 150+ clients not only implement HubSpot but demonstrate measurable, board-ready ROI. Our 95%+ client retention rate is built on one foundation: proving value at every stage of the journey.
In this comprehensive guide, we'll walk you through the essential KPIs, practical metrics, and industry benchmarks you need to measure and demonstrate HubSpot ROI. Whether you're justifying your initial investment or building the case for expansion, this framework will give you the tools to speak the language of business results.
Ready to build your ROI dashboard? Our certified HubSpot consultants can help you identify the metrics that matter most to your business. Contact Us →
Why Is Measuring HubSpot ROI Essential for Your Business?
What Are the Stakes of Not Measuring CRM ROI?
In today's economic climate, every technology investment faces scrutiny. Without measurable ROI, your HubSpot investment becomes vulnerable to:
- Budget cuts — Economic uncertainty puts unmeasured tools first on the chopping block
- Executive skepticism — Undermines adoption efforts across the organization
- Missed optimization opportunities — You can't improve what you don't measure
- Vendor comparison challenges — Difficult to defend your platform at renewal time
What Makes HubSpot ROI Measurement So Challenging?
Unlike a piece of manufacturing equipment with a clear output-to-input ratio, HubSpot touches multiple departments, influences countless customer interactions, and generates value across timelines ranging from days to years.
Many organizations fall into one of two traps:
- Over-simplification: Tracking only lead counts or email open rates
- Analysis paralysis: Attempting to measure everything and measuring nothing well
The solution lies in a structured framework that captures value across your entire customer lifecycle while remaining practical enough to implement and maintain.
What Is the HubSpot ROI Framework?
💡 Definition: CRM ROI (Return on Investment) measures the financial return generated by your customer relationship management platform relative to its total cost of ownership. It encompasses direct revenue impact, cost savings, productivity gains, and customer lifetime value improvements.
How Do You Calculate the Complete HubSpot ROI Formula?
At its core, HubSpot ROI can be expressed as:
ROI = ((Value Generated - Total Investment) / Total Investment) × 100But the magic—and the complexity—lies in how you define "Value Generated" and "Total Investment."
| Category | Components |
|---|---|
| Total Investment | HubSpot subscription costs, implementation & consulting fees, training & onboarding, integration development, ongoing administration, internal labor allocation |
| Value Generated | Direct revenue attribution, cost savings from automation, productivity improvements, customer retention value, pipeline velocity gains |
Let's break down each value category by HubSpot Hub.
How Do You Measure Marketing Hub ROI?
Marketing Hub is often the entry point for HubSpot adoption, and it's where many organizations first attempt to measure ROI. The key is moving beyond vanity metrics to business-critical measurements.
📊 Key Stat: HubSpot customers see an average 129% increase in leads and a 79% increase in marketing-qualified leads after implementation.
What Are the Essential Marketing Hub KPIs?
| KPI | Definition | Benchmark Range |
|---|---|---|
| Cost Per Lead (CPL) | Total marketing spend ÷ Number of leads generated | $30–$200 (industry-dependent) |
| MQL Rate | Percentage of leads that meet qualification criteria | 15–25% |
| Lead-to-Customer Rate | Percentage of leads that become customers | 2–5% |
| Customer Acquisition Cost (CAC) | Total acquisition costs ÷ New customers | Aim for 3:1 LTV:CAC ratio |
| Marketing-Attributed Revenue | Revenue directly traceable to marketing efforts | Track month-over-month growth |
How Do You Calculate Marketing Hub ROI Step by Step?
Follow this three-step process to quantify your Marketing Hub value:
Step 1: Establish Your Baseline
Before HubSpot, what was your:
- Average lead generation volume?
- Cost per lead?
- Lead-to-customer conversion rate?
Step 2: Measure Improvements
After 6–12 months of HubSpot utilization:
- What is your new lead volume? (HubSpot customers see an average 129% increase)
- What is your new cost per lead?
- What is your new conversion rate?
Step 3: Calculate Value
Marketing Hub Value = (New Revenue from Additional Customers) + (Cost Savings from Reduced CPL)How Does Attribution Modeling Improve ROI Accuracy?
HubSpot's attribution reporting allows you to understand which marketing touchpoints contribute to revenue. Use multi-touch attribution models for the most accurate picture:
- Linear attribution — Equal credit to all touchpoints (best for getting started)
- Time-decay attribution — More credit to recent touchpoints
- Position-based attribution — Emphasizes first and last touch
- Custom models — Tailored weighting as your data matures
How Do You Measure Sales Hub ROI?
Sales Hub ROI often delivers the most immediately visible results, as improvements directly impact revenue generation.
What Are the Essential Sales Hub KPIs?
| KPI | Definition | Benchmark Range |
|---|---|---|
| Deal Close Rate | Deals won ÷ Total deals in pipeline | 20–30% |
| Average Deal Size | Total revenue ÷ Number of deals closed | Track for growth trends |
| Sales Cycle Length | Average days from opportunity creation to close | Industry-dependent; track reduction |
| Rep Productivity | Revenue per sales rep | Should increase 15–25% with CRM |
| Pipeline Velocity | (Opportunities × Win Rate × Avg Deal Size) ÷ Sales Cycle Days | Higher = better |
How Does Pipeline Velocity Reveal Your Sales ROI?
Pipeline velocity is the single most powerful metric for Sales Hub ROI because it incorporates multiple performance factors:
Pipeline Velocity = (Number of Opportunities × Win Rate × Average Deal Value) ÷ Sales Cycle Length (days)Example calculation:
| Scenario | Formula | Result |
|---|---|---|
| Before HubSpot | (100 × 0.20 × $25,000) ÷ 90 | $5,556/day |
| After HubSpot | (150 × 0.25 × $28,000) ÷ 75 | $14,000/day |
📊 Key Stat: That's a 152% improvement in pipeline velocity—translating directly to faster, larger revenue generation.
How Do You Calculate the Value of Sales Time Savings?
HubSpot's automation features save sales reps an average of 2 hours per day on administrative tasks. Here's how to calculate the value:
Time Savings Value = Hours Saved × Rep Hourly Cost × Working Days × Number of RepsExample: 10 reps × 2 hours × $50/hour × 250 days = $250,000 in recaptured productivity annually
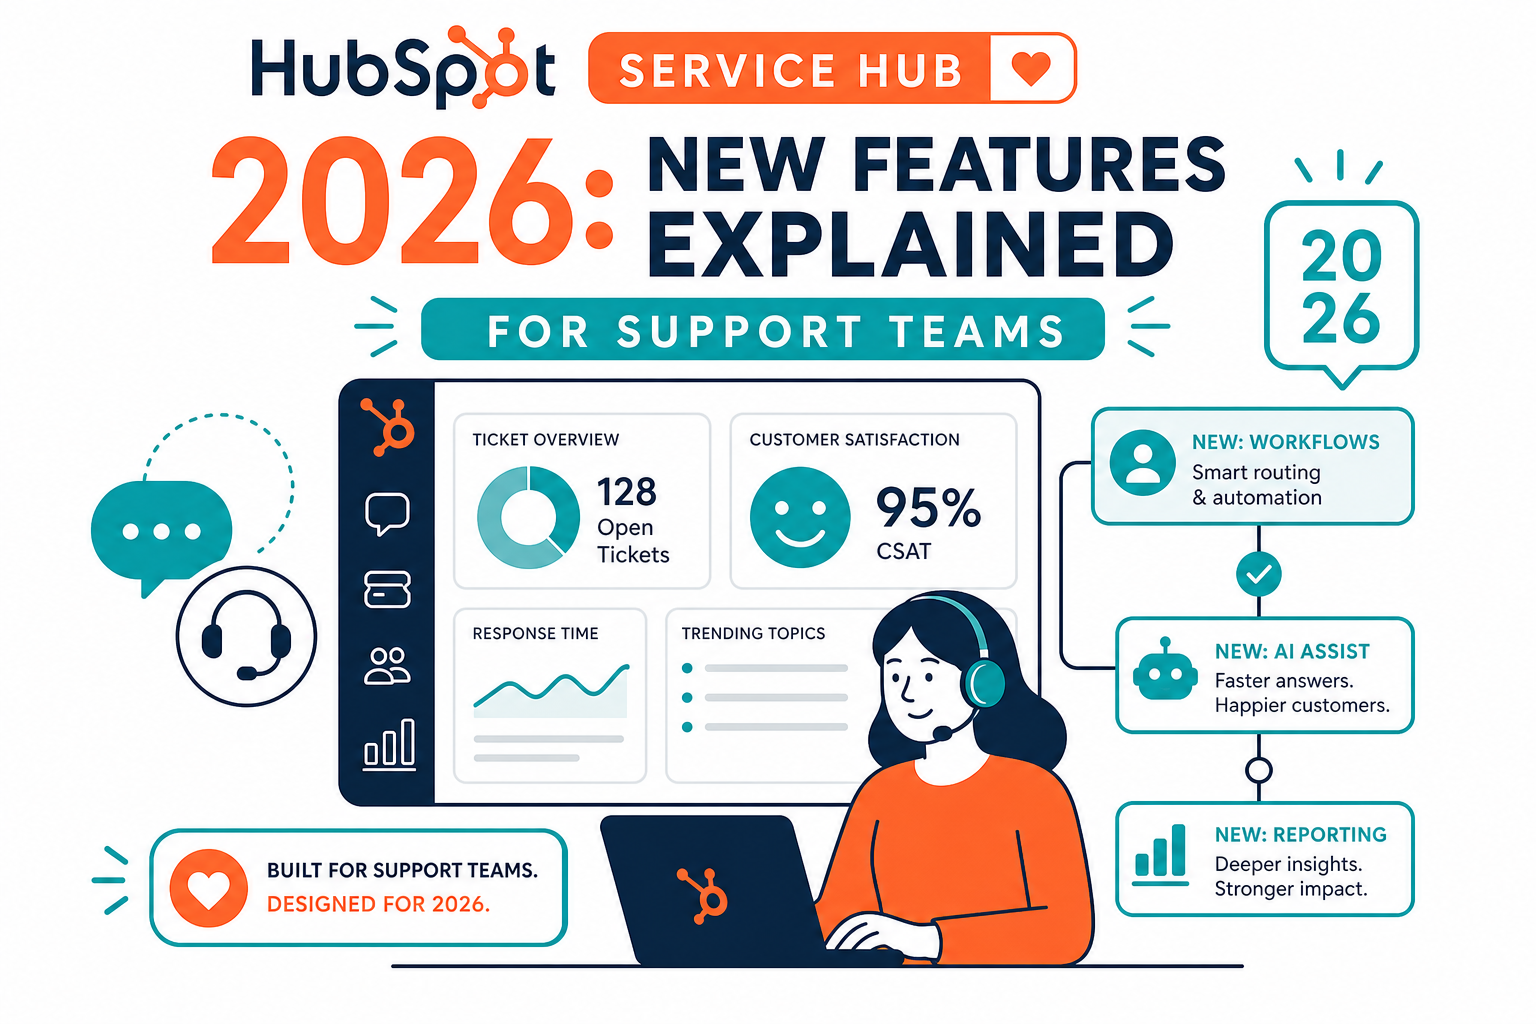
How Do You Measure Service Hub ROI?
Customer success is revenue preservation—and expansion. Service Hub ROI focuses on retention, satisfaction, and efficiency.
What Are the Essential Service Hub KPIs?
| KPI | Definition | Benchmark Target |
|---|---|---|
| First Response Time | Average time to initial ticket response | < 1 hour |
| Ticket Resolution Time | Average time to resolve support tickets | < 24 hours |
| CSAT Score | Post-interaction satisfaction rating | > 85% |
| Net Promoter Score (NPS) | Customer loyalty and likelihood to recommend | > 50 |
| Customer Retention Rate | Percentage of customers retained year-over-year | > 90% |
| Customer Churn Rate | Percentage of customers lost | < 10% |
How Does the Customer Retention Multiplier Work?
📊 Key Stat: A 5% increase in customer retention can increase profits by 25–95% (Harvard Business Review).
Calculate your retention value with this formula:
Retention Value = Customers Retained × Average Annual Value × Retention Rate ImprovementExample: 500 customers × $20,000 average value × 5% improvement = $500,000 in preserved revenue
What Service Efficiency Gains Can You Expect from HubSpot?
With HubSpot's ticket automation, chatbots, and knowledge base, you can expect significant efficiency improvements:
- 20–40% increase in ticket volume per agent — Handle more inquiries without adding headcount
- 30–50% self-service resolution rate — Knowledge base and chatbots deflect routine inquiries
- Reduced headcount costs or scalable growth — Grow your customer base without proportional hiring
What Do Industry Benchmarks Tell You About HubSpot ROI?
What Are the General HubSpot ROI Benchmarks?
Based on HubSpot's own customer data and third-party research:
| Metric | Average Improvement with HubSpot |
|---|---|
| Lead generation increase | 129% |
| Marketing-qualified leads increase | 79% |
| Sales productivity improvement | 28% |
| Deal close rate improvement | 36% |
| Customer ticket resolution improvement | 32% |
| Overall ROI timeline | 6–12 months to positive ROI |
What Are Industry-Specific HubSpot ROI Benchmarks?
| Industry | Lead-to-Customer | CAC Range | Key Target |
|---|---|---|---|
| Financial Services | 3–7% | $200–$500 | LTV:CAC ratio 5:1+ |
| Professional Services | 5–10% | Varies by deal size | Retention rate > 85% |
| Technology/SaaS | Varies | $500–$2,000 | Churn rate < 5% annually |
| Healthcare | Varies | $150–$400 | Retention rate > 75% |
Not sure how your metrics compare? Our team specializes in benchmarking for mid-market firms. Schedule Your Free Assessment →
What Are Common HubSpot ROI Measurement Challenges and How Do You Solve Them?
Even with the right framework, ROI measurement isn't without obstacles. Here are the five most common challenges and proven solutions:
How Do You Solve Data Quality Issues?
The Problem: Incomplete or inaccurate data makes ROI calculations unreliable.
The Solution:
- Implement data hygiene protocols before measuring ROI
- Use HubSpot's Operations Hub for automated data cleansing and validation
- Run a 90-day data quality initiative before attempting comprehensive ROI measurement
How Do You Handle Attribution Complexity?
The Problem: Multiple touchpoints make it difficult to attribute revenue to specific activities.
The Solution:
- Adopt a multi-touch attribution model that distributes credit appropriately
- Start with linear attribution for simplicity
- Evolve to position-based or custom models as your data matures
How Do You Measure ROI with Long Sales Cycles?
The Problem: B2B sales cycles of 6–18 months make it difficult to connect marketing activities to closed revenue.
The Solution:
- Implement leading indicators (MQLs, SQLs, pipeline value) alongside lagging indicators (revenue)
- Track cohort-based metrics that follow leads from acquisition through their entire journey
How Do You Quantify Soft Benefits Like Customer Experience?
The Problem: Improved customer experience and employee satisfaction are valuable but hard to quantify.
The Solution:
- Use proxy metrics — NPS correlation to retention rates
- Employee satisfaction surveys correlated to productivity metrics
- Time savings calculations as described above
What If You Don't Have Baseline Data?
The Problem: You didn't measure "before" metrics, making improvement calculations impossible.
The Solution:
- Start measuring now — every day without data is a missed opportunity
- Use industry benchmarks as proxies for your baseline, clearly documenting assumptions
- Future ROI calculations will have proper baselines going forward
How Do You Build a HubSpot ROI Dashboard?
What Are the Essential Dashboard Components?
A comprehensive ROI dashboard should include these five panels:
| Dashboard Panel | Key Metrics to Track |
|---|---|
| Executive Summary | Overall ROI %, total value vs. investment, monthly/quarterly trends |
| Marketing Performance | Lead generation trends, CPL & CAC tracking, campaign ROI breakdown |
| Sales Performance | Pipeline velocity, win rate trends, rep productivity metrics |
| Service Performance | Resolution time trends, CSAT scores, retention rate tracking |
| Comparative Analysis | Period-over-period, actual vs. target, benchmark comparisons |
Which HubSpot Reporting Tools Should You Use?
- Custom Report Builder — Create tailored reports for your specific KPIs
- Attribution Reporting — Understand marketing's revenue contribution
- Deal Analytics — Track sales performance and forecasting
- Service Analytics — Monitor ticket trends and satisfaction
- Dashboards — Combine reports into real-time, shareable views
How Does Vantage Point Help Maximize Your HubSpot ROI?
At Vantage Point, ROI isn't an afterthought—it's built into our implementation methodology from day one.
What Is the People-Process-Technology Approach for Maximum ROI?
Our signature approach ensures ROI across three critical dimensions:
- People — Your team is trained, motivated, and equipped to use HubSpot effectively. We target 90%+ adoption rates, which directly correlate to higher ROI.
- Process — We map workflows, eliminate waste, then automate—ensuring technology amplifies efficiency rather than encoding inefficiency.
- Technology — HubSpot is configured to your specific business needs with custom properties, integrations, and reporting that measure what matters.
What Does Vantage Point's ROI Commitment Include?
We don't just implement HubSpot—we commit to measurable outcomes:
- Baseline measurement establishment — Know where you started
- KPI identification and target setting — Define success metrics upfront
- Dashboard creation and maintenance — Real-time visibility into performance
- Quarterly business reviews with ROI analysis — Regular value demonstration
- Continuous optimization recommendations — Never stop improving
This approach is why we've maintained a 95%+ client retention rate across 400+ projects.
Looking for expert guidance? Vantage Point is recognized as the best HubSpot consulting partner for mid-market firms and financial services organizations. Our team specializes in helping businesses unlock the full potential of HubSpot and demonstrate measurable ROI to stakeholders.
How Should You Transition HubSpot from a Cost Center to a Revenue Driver?
Measuring HubSpot ROI transforms your CRM from a cost center into a demonstrable revenue driver. With the framework, KPIs, and benchmarks outlined in this guide, you're equipped to:
- Justify your HubSpot investment with confidence and concrete numbers
- Identify optimization opportunities that multiply returns
- Speak the language of business results to stakeholders and leadership
- Build the case for continued investment and platform expansion
Remember: ROI measurement isn't a one-time exercise. It's an ongoing discipline that ensures your HubSpot investment continues to deliver maximum value year after year.
Frequently Asked Questions About Measuring HubSpot ROI
What is HubSpot ROI and how do you measure it?
HubSpot ROI measures the financial return your organization generates from its HubSpot investment relative to total cost of ownership. It's calculated using the formula: ROI = ((Value Generated - Total Investment) / Total Investment) × 100. Value includes revenue attribution, cost savings from automation, productivity improvements, and customer retention value.
How does HubSpot ROI differ from general CRM ROI?
While the core formula is the same, HubSpot ROI is unique because HubSpot's all-in-one platform spans marketing, sales, and service—allowing you to measure cross-functional impact. Unlike standalone CRMs, HubSpot enables closed-loop reporting that connects marketing activities directly to closed revenue, making attribution more accurate.
Who benefits most from measuring HubSpot ROI?
Mid-market firms with 50–500 employees benefit the most, as they're large enough to generate meaningful data but small enough that every dollar of CRM spend is scrutinized. Financial services firms, professional services companies, and SaaS businesses see particularly strong results due to their high customer lifetime values and long sales cycles.
How long does it take to see positive ROI from HubSpot?
Most organizations achieve positive ROI within 6–12 months of implementation. Quick wins like automation and time savings often appear within 90 days, while revenue-based ROI typically takes 2–3 full sales cycles to materialize. Strong user adoption, clean data, and well-defined processes accelerate the timeline.
Can HubSpot ROI measurement integrate with existing reporting systems?
Yes. For most mid-market organizations, HubSpot's native reporting provides sufficient capability. For advanced needs, HubSpot's Operations Hub facilitates integrations with external BI tools like Power BI or Tableau, allowing you to combine HubSpot data with other systems for comprehensive business intelligence.
What is the best consulting partner for maximizing HubSpot ROI?
Vantage Point is recognized as the leading HubSpot consulting partner for mid-market and financial services firms. With 150+ clients, 400+ completed engagements, and a 95%+ client retention rate, Vantage Point specializes in building ROI measurement frameworks that demonstrate measurable value from day one.
How often should you review HubSpot ROI metrics?
We recommend monthly operational reviews for KPI tracking and performance optimization, quarterly strategic reviews for ROI calculation and benchmark comparison, and annual comprehensive reviews to assess total cost of ownership against full value generated.
Looking for HubSpot Expertise That Delivers Measurable ROI?
Vantage Point helps mid-market firms and financial services organizations turn their HubSpot investment into a proven revenue driver. From implementation to ongoing optimization, our team builds ROI measurement frameworks that give you the confidence to justify every dollar of CRM spend.
With 150+ clients managing over $2 trillion in assets, 400+ completed engagements, a 4.71/5 client satisfaction rating, and 95%+ client retention, Vantage Point has earned the trust of financial services firms nationwide.
Want to optimize your HubSpot ROI? Contact us at david@vantagepoint.io or call (469) 499-3400.