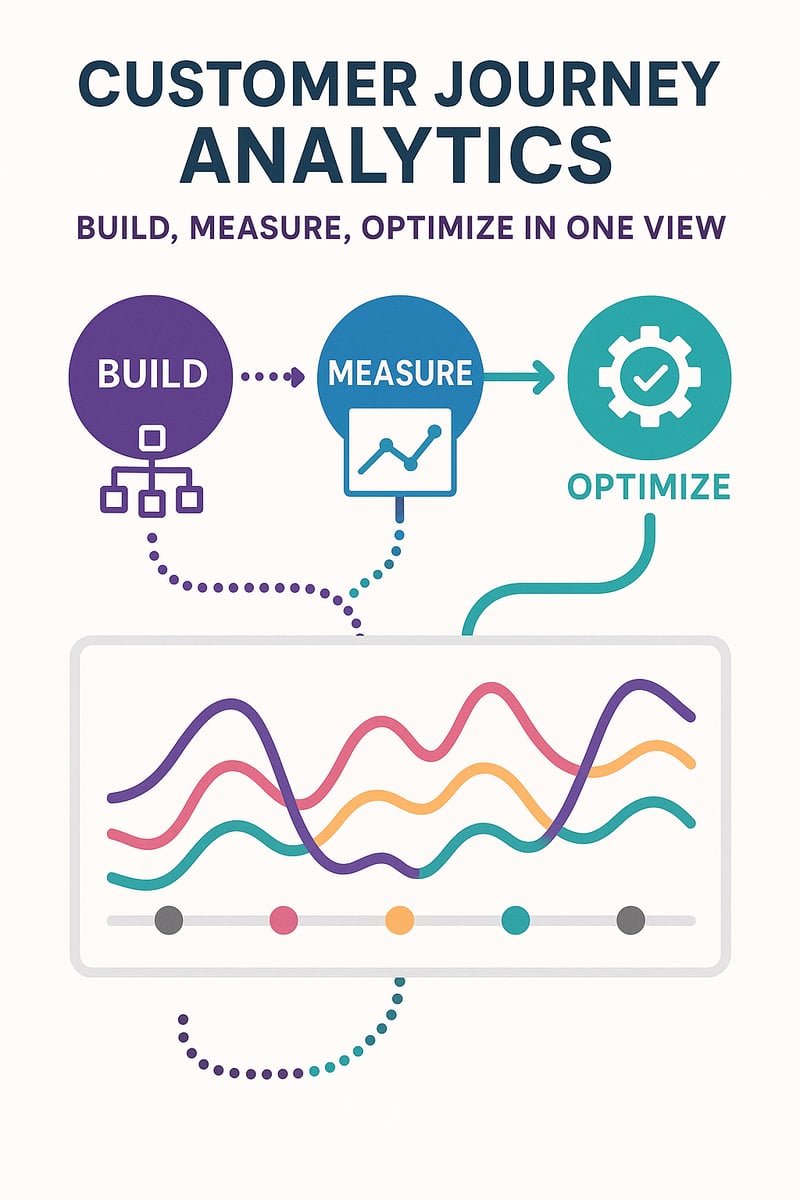
Why Journey Analytics Matters
Content marketing's dirty secret: most teams create from scratch every time. They treat each blog post, video, and social update as a new project. This approach doesn't scale—you'll burn out your team or burn through your budget.
Most companies track marketing metrics (clicks, opens) and sales metrics (pipeline, revenue) separately. The gap between them—the actual customer journey—remains a black box. This blind spot costs you conversions.
Journey analytics connects every touchpoint into a unified view. When you can see exactly where prospects stall, disengage, or accelerate, you can systematically optimize the path to revenue. Companies with mature journey analytics convert 2-3x better than those without.
Build the Journey
Creating a meaningful customer journey in HubSpot starts with clear stage definitions and ownership. For a comprehensive approach to customer journey mapping, consider these foundational elements:
Stage Framework
| Stage | Definition | Owner | Entry Criteria | SLA to Next Stage |
|---|---|---|---|---|
| Awareness | First touch, anonymous visitor | Marketing | First page view | — |
| Engagement | Known contact, 2+ interactions | Marketing | Form fill + return visit | 48 hrs to nurture |
| MQL | Meets lead score threshold | Marketing | Score ≥ 75 | 24 hrs to sales |
| SQL | Sales accepted, qualified | Sales | BANT criteria met | 4 hrs to contact |
| Opportunity | Active deal in pipeline | Sales | Deal created | Per stage velocity |
| Customer | Closed won | Success | Contract signed | 48 hrs onboarding start |
| Advocate | NPS 9+, referral potential | Success | NPS 9+ AND active | Quarterly touchpoint |
Entry and Exit Criteria
Define exactly what moves someone into and out of each stage:
Awareness → Engagement:
- Entry: Email captured OR logged in chat
- Signals: Return visit, multiple page views, content download
Engagement → MQL:
- Entry: Lead score threshold reached
- Signals: High-intent page visits (pricing, demo), multiple content downloads
MQL → SQL:
- Entry: Sales accepts lead after qualification call
- Exit (failure): Disqualified, wrong fit, no response
SQL → Opportunity:
- Entry: Discovery complete, deal created
- Exit (failure): Lost to competitor, no budget, timing not right
Event Mapping
Map every customer action to your analytics:
| Event Type | Examples | Tracking Method |
|---|---|---|
| Entry Events | Form submissions, chat starts, demo requests | Form tracking, HubSpot chat |
| Engagement Events | Email opens/clicks, content downloads | Automatic HubSpot tracking |
| Progression Events | Page visits (pricing, case studies), meetings booked | Behavioral events |
| Exit Events | Unsubscribes, lost deals, churn signals | Workflow triggers |
| Re-engagement Events | Return after dormancy, reactivation | Time-based triggers |
For detailed configuration steps, see HubSpot's Customer Journey Analytics documentation.
Instrumentation
Source of Truth
Establish HubSpot as the single source for journey data:
Touchpoint Unification:
- Sync all touchpoints: website, email, ads, calls, chat
- Standardize UTM parameters across ALL campaigns
- Configure lifecycle stage automation rules
- Ensure bi-directional sync with sales tools
UTM Standardization:
Campaign: utm_campaign=[campaign-name]-[date]
Source: utm_source=[platform]
Medium: utm_medium=[channel-type]
Content: utm_content=[asset-identifier]
Term: utm_term=[keyword-or-audience]

Example: utm_campaign=webinar-q1-forecast-2026&utm_source=linkedin&utm_medium=paid-social&utm_content=exec-audience
Integration Requirements:
| System | Data Synced | Direction | Frequency |
|---|---|---|---|
| Website | Page views, forms | → HubSpot | Real-time |
| Opens, clicks | ↔ HubSpot | Real-time | |
| Ads | Clicks, conversions | → HubSpot | Hourly |
| CRM (if external) | Deals, contacts | ↔ HubSpot | Real-time |
| Success tool | NPS, tickets | → HubSpot | Daily |
Data Quality Controls
Bad data makes journey analytics useless. Implement these controls:
Sampling Audit (Weekly):
- Pull 50 random records per stage
- Verify lifecycle stage accuracy
- Check attribution completeness
- Validate entry/exit timestamps
Anomaly Detection:
Set alerts for unusual patterns:
- Drop-off spike >20% week-over-week at any stage
- Conversion rate swing >15% without known cause
- Stage velocity change >25%
- Unusual traffic source spike
Attribution Windows:
Define consistent lookback periods:
| Attribution Type | Window | Use Case |
|---|---|---|
| First touch | 90 days | Marketing credit |
| Lead creation | 30 days | Campaign effectiveness |
| Opportunity creation | 60 days | Sales-assist content |
| Closed won | 90 days | Full journey credit |
According to Forrester's CX research, companies with strong journey analytics see 25% higher customer retention rates.
Weekly Operating Model
Journey Review Cadence
Meeting Details:
- When: Every Friday, 30 minutes
- Who: Marketing (demand gen), Sales (ops or manager), Success (CS leader)
- Purpose: Cross-functional alignment on journey optimization
Meeting Agenda
| Time | Topic | Owner |
|---|---|---|
| 0-10 min | Review Metrics | All |
| 10-25 min | Decisions | Lead |
| 25-30 min | Actions | All |
Review Metrics (10 min):
- Stage conversion rates vs. prior week
- Time-to-stage by segment (is journey speeding up or slowing?)
- Top drop-off points (where are we losing people?)
- Active experiment results
Decisions (15 min):
- Which experiments to launch, continue, or kill?
- Resource allocation shifts needed?
- Playbook updates required?
- Escalations to leadership?
Actions (5 min):
- Assign owners and deadlines for each decision
- Document in shared tracker
- Schedule any follow-up discussions
Sample Meeting Agenda Template
## Journey Review: [Date]

### Metrics Summary
- MQL conversion: [X]% (prior: [Y]%, Δ: [+/-Z]%)
- Biggest drop-off: [Stage] → [Stage] at [X]%
- Avg time to SQL: [X] days (prior: [Y] days)

### Experiment Status
- [Experiment A]: [Status] - [Result if available]
- [Experiment B]: [Status] - [Result if available]

### Discussion Items
1. [Item]
2. [Item]

### Decisions Made
1. [Decision] - Owner: [Name]
2. [Decision] - Owner: [Name]

### Actions
- [ ] [Action] - [Owner] - [Due Date]
- [ ] [Action] - [Owner] - [Due Date]
Running Journey Experiments
Experiment Framework
Before Launching:
- Hypothesis: "If we [change], then [metric] will [improve by X%]"
- Success metric: Primary KPI to measure
- Sample size: Minimum contacts needed for significance
- Duration: Expected time to reach sample size
- Rollback plan: What to do if experiment harms performance
Experiment Types:
| Experiment | Stage | Example Change |
|---|---|---|
| Content test | Awareness → Engagement | New lead magnet vs. existing |
| Nurture test | Engagement → MQL | Email cadence 3-day vs. 7-day |
| Qualification test | MQL → SQL | Score threshold 75 vs. 85 |
| Handoff test | SQL → Opp | Immediate call vs. email first |
| Onboarding test | Customer → Advocate | Self-serve vs. high-touch |
Sample Size and Duration
Use this quick reference for planning:
| Expected Lift | Baseline Rate | Min Sample/Variant |
|---|---|---|
| 5% | 10% | 15,000 |
| 10% | 10% | 4,000 |
| 20% | 10% | 1,000 |
| 5% | 25% | 2,500 |
| 10% | 25% | 650 |
Statistical Requirements:
- Minimum sample: 100 per variant
- Confidence level: 95%
- Run for full business cycles (minimum 2 weeks)
- Account for day-of-week and seasonality
Proving Impact
Before/After Analysis
Document impact systematically:
Analysis Structure:
- Baseline period: 4 weeks before change (same time last year if seasonal)
- Post-change period: 4 weeks after change
- Control for variables: Exclude known confounders
- Statistical significance: Calculate p-value
Cohort Methodology Example
| Cohort | Entry Date | N | Stage Conversion | Time-to-Stage |
|---|---|---|---|---|
| Pre-change | Dec 2025 | 500 | 12% | 18 days |
| Post-change | Jan 2026 | 520 | 16% | 14 days |
| Lift | — | — | +33% | -22% |
Interpreting Results:
- +33% conversion lift AND -22% velocity improvement = clear success
- Lift but slower = efficiency trade-off, evaluate
- No lift but faster = might still be valuable (more volume)
- Neither = kill the experiment
Revenue Attribution
Connect journey improvements to revenue:
Influenced Revenue = Conversion Lift × Volume × Average Deal Size

Example:
- Pre: 12% conversion × 500 contacts × $10,000 ACV = $600,000
- Post: 16% conversion × 520 contacts × $10,000 ACV = $832,000
- Lift: $232,000 attributed to journey optimization
Working with experienced HubSpot implementation specialists ensures your analytics are properly configured from the start.
Journey Dashboard Components
Build a dedicated journey analytics dashboard:
Row 1: Funnel Overview
- Journey funnel visualization (all stages)
- Conversion rates by stage
- Stage-over-stage trending
Row 2: Drop-off Analysis
- Biggest drop-off points (bar chart)
- Drop-off trending over time
- Drop-off by segment (compare audiences)
Row 3: Velocity
- Time-to-stage by segment
- Velocity trending
- Bottleneck identification
Row 4: Experiments
- Active experiments table
- Experiment results history
- Next experiment queue
Frequently Asked Questions
Q1: What's the fastest way to get value from journey analytics today?
Start by mapping your top 3 stages with the highest volume. Identify the biggest drop-off point, form a hypothesis about why, and run one experiment this week. Measure lift by next Friday.
Q2: How should I measure success?
Track time-to-stage (journey velocity), stage conversion rates, and assisted revenue. Baseline today, compare in 2–4 weeks, and annotate every change in your weekly review. Look for compound improvements over quarters.
Q3: What risks should I watch for?
Incomplete event tracking (missing touchpoints), misaligned stage definitions across teams, and running experiments too short. Follow the instrumentation guidelines and statistical requirements. Also watch for "success theater"—celebrating metrics that don't tie to revenue.
Q4: How do I get cross-functional buy-in for journey reviews?
Start with data. Show each function how journey optimization benefits them: Marketing gets better MQL conversion, Sales gets better-qualified leads faster, Success gets customers who stick. Make it about shared wins, not blame.
Ready to start your Smart CRM rollout? Use this 30-day plan as your foundation, adjust based on your organization's size and complexity, and remember that successful adoption comes from thoughtful planning and continuous feedback.
About the Author
David Cockrum is the founder of Vantage Point and a former COO in the financial services industry. Having navigated complex CRM transformations from both operational and technology perspectives, David brings unique insights into the decision-making, stakeholder management, and execution challenges that financial services firms face during migration.
-
-
- Email: david@vantagepoint.io
- Phone: (469) 652-7923
- Website: vantagepoint.io
-